WTI is set to end the week with substantial losses of 8.40% (Pivot Orderbook analysis)
…
This is a premium post.
[s2If !current_user_can(access_s2member_level4)]Please register for PREMIUM VERSION HERE to read full post below containing analysis. In case of any error or you think you are not able to read the full post below, please email us at support#nehcap.com [lwa][/s2If] [s2If current_user_can(access_s2member_level4)]
- WTI is set to end the week with substantial losses of 8.40%
- The jobs report showed a slowdown in wages, while the labor market remains resilient.
- WTI failed to capitalize on US Dollar weakness after the US Services PMI shrinkage
The pair currently trades last at 73.87.
The previous day high was 75.07 while the previous day low was 72.64. The daily 38.2% Fib levels comes at 74.14, expected to provide resistance. Similarly, the daily 61.8% fib level is at 73.57, expected to provide support.
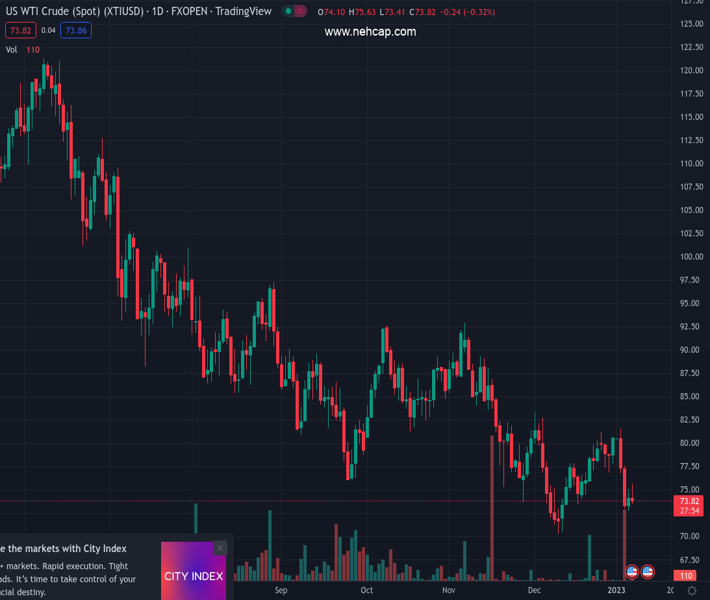
Western Texas Intermediate (WTI), the US crude oil benchmark, hovers at around $73.70s, almost flat, albeit the US Dollar (USD) weakened sharply due to mixed US economic data, though global recession concerns weighed on oil prices. At the time of writing, WTI exchanges hand at $73.71.
Wall Street is poised to end Friday’s session with hefty losses, boosted by disappointing PMIs. The ISM Services PMI plummeted to 49.6, below estimates of 55, on the lowest reading since May 2020. Meanwhile, the US economy added 223K people to its workforce, more than expected, the unemployment rate dropped, and wages aimed down, to 4.6% YoY, against estimates of 5%.
Consequently, the US Dollar turned south, plummeting below the 104.000 mark and down by 1.20%, though WTI failed to capitalize on that.
Back to oil-related news, Saudi Arabia lowered prices for Asia customers to their lowest since November 2021 as global pressures hit oil prices. Factors like China’s reopening and its Covid-19 outbreak keep investors uneasy as additional countries imposed restrictions on visitors from China.
Technical Levels: Supports and Resistances
XTIUSD currently trading at 73.87 at the time of writing. Pair opened at 73.88 and is trading with a change of -0.01 % .
| Overview | Overview.1 | |
|---|---|---|
| 0 | Today last price | 73.87 |
| 1 | Today Daily Change | -0.01 |
| 2 | Today Daily Change % | -0.01 |
| 3 | Today daily open | 73.88 |
The pair remains strongly bearish on the daily time frame. It trades below the 20 SMA @ 76.95, 50 SMA 80.22, 100 SMA @ 83.25 and 200 SMA @ 93.14.
| Trends | Trends.1 | |
|---|---|---|
| 0 | Daily SMA20 | 76.95 |
| 1 | Daily SMA50 | 80.22 |
| 2 | Daily SMA100 | 83.25 |
| 3 | Daily SMA200 | 93.14 |
The previous day high was 75.07 while the previous day low was 72.64. The daily 38.2% Fib levels comes at 74.14, expected to provide resistance. Similarly, the daily 61.8% fib level is at 73.57, expected to provide support.
Note the levels of interest below:
- Pivot support is noted at 72.66, 71.44, 70.24
- Pivot resistance is noted at 75.08, 76.29, 77.51
| Levels | Levels.1 |
|---|---|
| Previous Daily High | 75.07 |
| Previous Daily Low | 72.64 |
| Previous Weekly High | 81.19 |
| Previous Weekly Low | 76.86 |
| Previous Monthly High | 83.30 |
| Previous Monthly Low | 70.27 |
| Daily Fibonacci 38.2% | 74.14 |
| Daily Fibonacci 61.8% | 73.57 |
| Daily Pivot Point S1 | 72.66 |
| Daily Pivot Point S2 | 71.44 |
| Daily Pivot Point S3 | 70.24 |
| Daily Pivot Point R1 | 75.08 |
| Daily Pivot Point R2 | 76.29 |
| Daily Pivot Point R3 | 77.51 |
[/s2If]
Join Our Telegram Group
")


