#USDJPY @ 132.934 December’s US Nonfarm Payrolls data weakened the US Dollar, even though the labor market remains tight. (Pivot Orderbook analysis)
…
This is a premium post.
[s2If !current_user_can(access_s2member_level4)]Please register for PREMIUM VERSION HERE to read full post below containing analysis. In case of any error or you think you are not able to read the full post below, please email us at support#nehcap.com [lwa][/s2If] [s2If current_user_can(access_s2member_level4)]
- December’s US Nonfarm Payrolls data weakened the US Dollar, even though the labor market remains tight.
- Average Hourly Earnings easing sparked speculations for a dovish move of the Federal Reserve in the February meeting.
- USD/JPY Price Analysis: Likely to remain downward biased below 133.00.
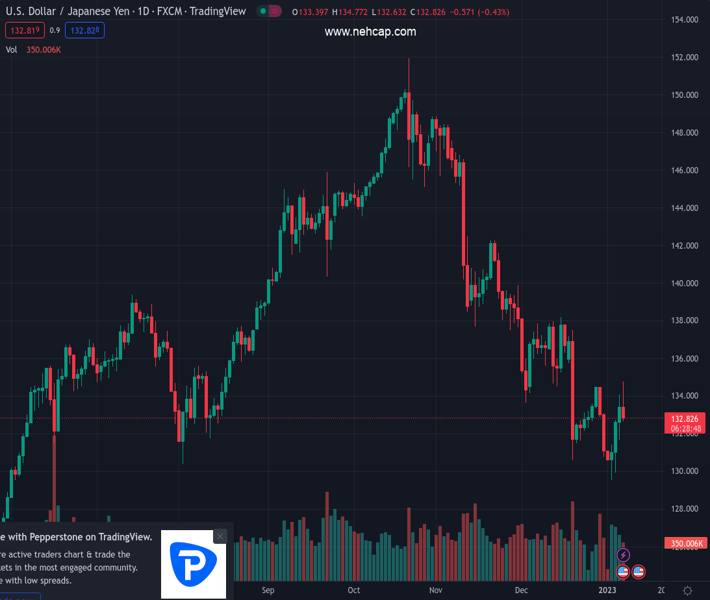
The pair currently trades last at 132.934.
The previous day high was 134.06 while the previous day low was 131.68. The daily 38.2% Fib levels comes at 133.15, expected to provide resistance. Similarly, the daily 61.8% fib level is at 132.59, expected to provide support.
The USD/JPY struggles at the 200-day Exponential Moving Average (EMA) around 134.82, dropping beneath the 134.00 mark, after US economic data, although positive, weighed on the US Dollar, exacerbating a fall of 100 pips in the major. At the time of writing, the USD/JPY is trading at 132.81, below its opening price by 0.44%.
The US Department of Labor revealed that Nonfarm Payrolls in December increased by 223K, above estimates of 200K, data showed on Friday. The Unemployment Rate fell to 3.5% YoY, against estimates of 3.7%, while Average hourly earnings rose 4.6%, below the market consensus of 5.0%, welcomed news for Fed officials, who see wage pressures as a hurdle to tackle inflation.
The Wall Street Journal (WSJ) Fed Watcher Nick Timiraos Tweeted that “revisions to average hourly earnings data paint a marginally less worrisome picture for the Fed on wages than the Nov report.”
The US Dollar Index, which measures the buck’s value against a basket of rivals, tumbled below the 105.000 mark, spurred by that Timiraous Tweet, at 104.963. Nevertheless, it recovered some ground, above 105.000 before reversing its trend, and turned negative at around 104.682, down by 0.46%.
Meanwhile, US Treasury bond yields edged lower by nine bps, down at 3.625%, a headwind for the USD/JPY, which is diving from daily highs reached at 134.77.
Of late, Atlanta’s Fed President Raphael Bostic is crossing newswires. He said that December’s labor market data does not change his outlook on the economy, adding that the Fed needs to stay the course as inflation remains too high. Bostic’s base case for the Federal Funds rate (FFR) is to hit the 5.00-5.25% range, and to stay at that level, well into 2024.
In the short term, the USD/JPY hourly chart flashes the US Dollar continues to weaken, extending its gains beneath the daily pivot point at 133.04. On its way down, the USD/JPY cleared the 20 and 50-EMAs, though a downslope trendline and the confluence of the 100 and 200-EMAs around 132.55/57 might stall the fall, shy of the S1 daily pivot at 132.03. On the flip side, if the USD/JPY reclaims 133.00, that could open the door for a resumption of the uptrend, exposing resistance levels like the 134.00 mark, followed by the R1 daily pivot point at 134.45.
Technical Levels: Supports and Resistances
USDJPY currently trading at 133.0 at the time of writing. Pair opened at 133.36 and is trading with a change of -0.27 % .
| Overview | Overview.1 | |
|---|---|---|
| 0 | Today last price | 133.00 |
| 1 | Today Daily Change | -0.36 |
| 2 | Today Daily Change % | -0.27 |
| 3 | Today daily open | 133.36 |
The pair remains strongly bearish on the daily time frame. It trades below the 20 SMA @ 133.95, 50 SMA 138.33, 100 SMA @ 140.99 and 200 SMA @ 136.41.
| Trends | Trends.1 | |
|---|---|---|
| 0 | Daily SMA20 | 133.95 |
| 1 | Daily SMA50 | 138.33 |
| 2 | Daily SMA100 | 140.99 |
| 3 | Daily SMA200 | 136.41 |
The previous day high was 134.06 while the previous day low was 131.68. The daily 38.2% Fib levels comes at 133.15, expected to provide resistance. Similarly, the daily 61.8% fib level is at 132.59, expected to provide support.
Note the levels of interest below:
- Pivot support is noted at 132.01, 130.66, 129.64
- Pivot resistance is noted at 134.39, 135.41, 136.76
| Levels | Levels.1 |
|---|---|
| Previous Daily High | 134.06 |
| Previous Daily Low | 131.68 |
| Previous Weekly High | 134.50 |
| Previous Weekly Low | 130.78 |
| Previous Monthly High | 138.18 |
| Previous Monthly Low | 130.57 |
| Daily Fibonacci 38.2% | 133.15 |
| Daily Fibonacci 61.8% | 132.59 |
| Daily Pivot Point S1 | 132.01 |
| Daily Pivot Point S2 | 130.66 |
| Daily Pivot Point S3 | 129.64 |
| Daily Pivot Point R1 | 134.39 |
| Daily Pivot Point R2 | 135.41 |
| Daily Pivot Point R3 | 136.76 |
[/s2If]
Join Our Telegram Group
")


