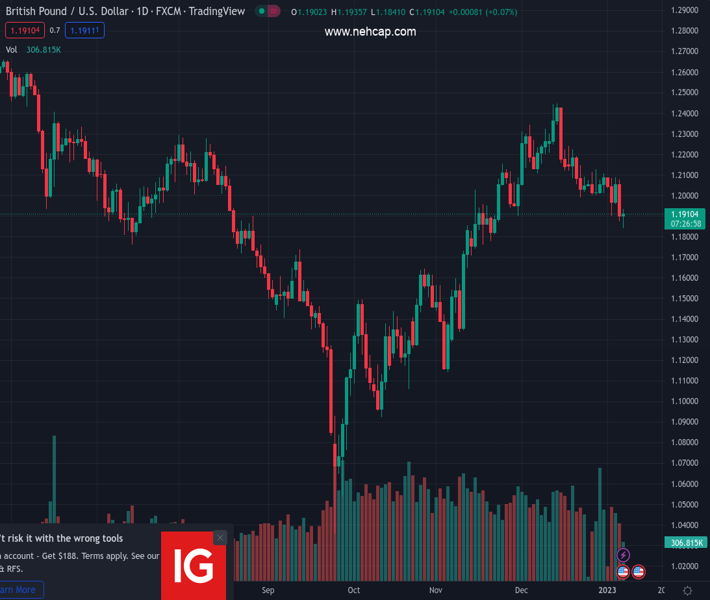
#GBPUSD @ 1.18997 US Nonfarm Payrolls rose by 223K, exceeding estimates, while the unemployment rate fell. (Pivot Orderbook analysis)
…
This is a premium post.
[s2If !current_user_can(access_s2member_level4)]Please register for PREMIUM VERSION HERE to read full post below containing analysis. In case of any error or you think you are not able to read the full post below, please email us at support#nehcap.com [lwa][/s2If] [s2If current_user_can(access_s2member_level4)]
- US Nonfarm Payrolls rose by 223K, exceeding estimates, while the unemployment rate fell.
- Average Hourly Earnings were lower than the 5% foreseen, signaling that inflation on wages is easing.
- GBP/USD Price Analysis: The rally could cap around the 50-EMA and daily pivot confluence around 1.1950.
The pair currently trades last at 1.18997.
The previous day high was 1.2078 while the previous day low was 1.1873. The daily 38.2% Fib levels comes at 1.1952, expected to provide resistance. Similarly, the daily 61.8% fib level is at 1.2, expected to provide resistance.
The GBP/USD is trimming some of its Thursday losses, as the US Department of Labor released upbeat economic data, which was positive, though the US Dollar (USD) is weakening across the board. Therefore, the GBP/USD is trading volatile at around 1.1900-1.1920 after hitting a daily low of 1.1841.
Investors’ mood remains upbeat following the release of December’s US Nonfarm Payrolls report by the US Bureau of Labor Statistics. Payrolls jumped by 223K exceeding estimates of 200K, flashing a solid labor market and justifying the need for further Federal Reserve’s (Fed) tightening. Data showed that the Unemployment Rate dropped to 3.5%, while Average Hourly Earnings dropped to 4.6% YoY, vs. estimates of 5%.
According to a tweet by Wall Street Journal (WSJ) Fed Watcher Nick Timiraos, “revisions to average hourly earnings data paint a marginally less worrisome picture for the Fed on wages than the Nov report.” That said, the US Dollar Index, which measures the buck’s value against a basket of rivals, tumbled below the 105.000 mark, spurred by that Tweet, down by 0.19%, at 104.963, a tailwind for the GBP/USD, which remains negative in the week by 1.38%, though in the day, registering minuscule gains of 0.13%.
Regarding US Treasury bond yields, the 10-year benchmark note rate edged lower by four bps, down at 3.675%, while the CME FedWatch Tool shows that odds for a 25 bps rate hike in the February meeting are approaching the 70% threshold.
Per the GBP/USD 1-hour chart, the pair jumped from around 1.1850, rallying sharply towards the 1.1920 mark. On its way north, it cracked the 20-EMA at 1.1906, though it remained slightly shy of reaching the daily pivot point at around 1.1952. The Relative Strength Index (RSI) crossed above its 50 mid-line, while the Rate of Change (RoC) indicates buying pressure is building. Therefore, the GBP/USD key resistance levels would be 1.1952, followed by the 100-EMA at 1.1979 and the 200-EMA at 1.2016.
As an alternate scenario, GBP/USD first support level would be the 20-EMA at 1.1906, above the 1.1900 figure, followed by today’s daily low of 1.1841.
Technical Levels: Supports and Resistances
GBPUSD currently trading at 1.1907 at the time of writing. Pair opened at 1.191 and is trading with a change of 0.13 % .
| Overview | Overview.1 | |
|---|---|---|
| 0 | Today last price | 1.1907 |
| 1 | Today Daily Change | 0.0016 |
| 2 | Today Daily Change % | 0.1300 |
| 3 | Today daily open | 1.1910 |
The pair is trading below its 20 Daily moving average @ 1.2119, below its 50 Daily moving average @ 1.1947 , above its 100 Daily moving average @ 1.1666 and below its 200 Daily moving average @ 1.2024
| Trends | Trends.1 | |
|---|---|---|
| 0 | Daily SMA20 | 1.2119 |
| 1 | Daily SMA50 | 1.1947 |
| 2 | Daily SMA100 | 1.1666 |
| 3 | Daily SMA200 | 1.2024 |
The previous day high was 1.2078 while the previous day low was 1.1873. The daily 38.2% Fib levels comes at 1.1952, expected to provide resistance. Similarly, the daily 61.8% fib level is at 1.2, expected to provide resistance.
Note the levels of interest below:
- Pivot support is noted at 1.1829, 1.1749, 1.1624
- Pivot resistance is noted at 1.2034, 1.2159, 1.2239
| Levels | Levels.1 |
|---|---|
| Previous Daily High | 1.2078 |
| Previous Daily Low | 1.1873 |
| Previous Weekly High | 1.2126 |
| Previous Weekly Low | 1.2002 |
| Previous Monthly High | 1.2447 |
| Previous Monthly Low | 1.1992 |
| Daily Fibonacci 38.2% | 1.1952 |
| Daily Fibonacci 61.8% | 1.2000 |
| Daily Pivot Point S1 | 1.1829 |
| Daily Pivot Point S2 | 1.1749 |
| Daily Pivot Point S3 | 1.1624 |
| Daily Pivot Point R1 | 1.2034 |
| Daily Pivot Point R2 | 1.2159 |
| Daily Pivot Point R3 | 1.2239 |
[/s2If]
Join Our Telegram Group
")


