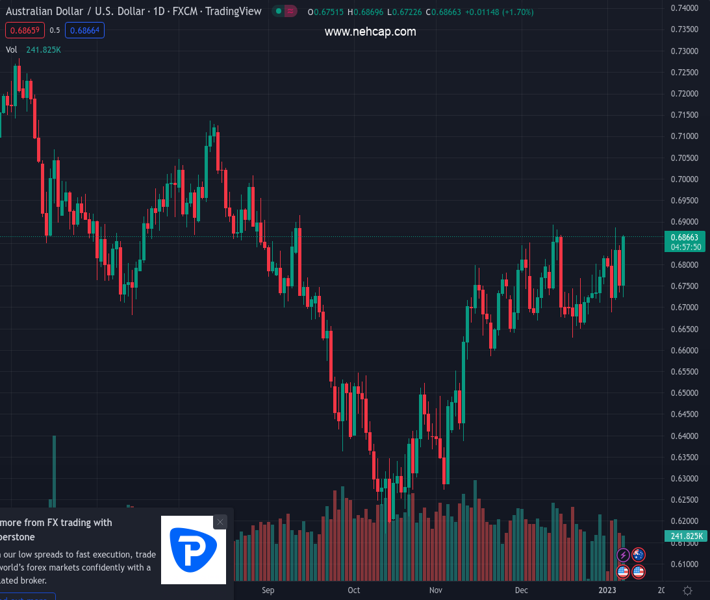
#AUDUSD @ 0.68663 surged on weak US ISM Services data, which contracted to its lowest since 2020. (Pivot Orderbook analysis)
…
This is a premium post.
[s2If !current_user_can(access_s2member_level4)]Please register for PREMIUM VERSION HERE to read full post below containing analysis. In case of any error or you think you are not able to read the full post below, please email us at support#nehcap.com [lwa][/s2If] [s2If current_user_can(access_s2member_level4)]
- AUD/USD surged on weak US ISM Services data, which contracted to its lowest since 2020.
- The US economy added more jobs than estimated while wage growth eases, helping the Federal Reserve’s job to tame inflation.
- Fed policymakers reiterated the need to curb inflation, emphasizing that they will stay the course.
The pair currently trades last at 0.68663.
The previous day high was 0.6845 while the previous day low was 0.6735. The daily 38.2% Fib levels comes at 0.6777, expected to provide support. Similarly, the daily 61.8% fib level is at 0.6803, expected to provide support.
The Australian Dollar (AUD) rallied against the US Dollar (USD) after the release of crucial economic data in the United States (US), although upbeat, failed to underpin the USD. Additionally, a services PMI survey dropped to contractionary territory, fueling speculations for a recession in the US. At the time of writing, the AUD/USD is trading at 0.6866, some 40 pips above the 200-day Exponential Moving Average (EMA).
December’s labor market data in the US painted a mixed report. Although 223K jobs were added to the economy exceeding estimates of 200K, fears that wage inflation would remain stickier waned. Average Hourly Earnings rose by 0.3% MoM, but on an annual basis, fell to 4.6% compared to 5.0% consensus. The slowdown would be welcomed by Fed policymakers, who see wage pressures as one of the factors keeping inflation above its 2% target.
The AUD/USD edged higher on the release and aimed toward the 0.6800 mark. However, weaker-than-expected ISM Services data and shrinkage of US Factory Orders added another leg up in the AUD/USD, extending its gains towards a two-day high of 0.6849.
The ISM Services PMI unexpectedly contracted to 49.6 vs. 55 estimates, and its lowest reading since May 2020, and trailed November’s 56.5 jumps, data released Friday showed. PMI readings below the 50-line signals contraction.
Aside from this, Fed speakers continued to cross newswires. Earlier, Atlanta’s Fed President Raphael Bostic said that December’s employment report does not change his outlook on the economy, emphasizing the need to “stay the course.” Later, Federal Reserve Governor Lisa D. Cooks said that inflation is “far too high” and of “great concern” despite recent reports.
Australia’s next week’s data would feature Building Permits, the release of the Monthly Consumer Price Index (CPI), Retail Sales and the Trade Balance. On the US front, its calendar will feature the Consumer Price Index (CPI), unemployment claims, and the University of Michigan (UoM) Consumer Sentiment.
Technical Levels: Supports and Resistances
AUDUSD currently trading at 0.6842 at the time of writing. Pair opened at 0.6752 and is trading with a change of 1.33 % .
| Overview | Overview.1 | |
|---|---|---|
| 0 | Today last price | 0.6842 |
| 1 | Today Daily Change | 0.0090 |
| 2 | Today Daily Change % | 1.3300 |
| 3 | Today daily open | 0.6752 |
The pair is trading above its 20 Daily moving average @ 0.675, above its 50 Daily moving average @ 0.6675 , above its 100 Daily moving average @ 0.6634 and below its 200 Daily moving average @ 0.6849
| Trends | Trends.1 | |
|---|---|---|
| 0 | Daily SMA20 | 0.6750 |
| 1 | Daily SMA50 | 0.6675 |
| 2 | Daily SMA100 | 0.6634 |
| 3 | Daily SMA200 | 0.6849 |
The previous day high was 0.6845 while the previous day low was 0.6735. The daily 38.2% Fib levels comes at 0.6777, expected to provide support. Similarly, the daily 61.8% fib level is at 0.6803, expected to provide support.
Note the levels of interest below:
- Pivot support is noted at 0.671, 0.6667, 0.66
- Pivot resistance is noted at 0.682, 0.6887, 0.693
| Levels | Levels.1 |
|---|---|
| Previous Daily High | 0.6845 |
| Previous Daily Low | 0.6735 |
| Previous Weekly High | 0.6821 |
| Previous Weekly Low | 0.6710 |
| Previous Monthly High | 0.6893 |
| Previous Monthly Low | 0.6629 |
| Daily Fibonacci 38.2% | 0.6777 |
| Daily Fibonacci 61.8% | 0.6803 |
| Daily Pivot Point S1 | 0.6710 |
| Daily Pivot Point S2 | 0.6667 |
| Daily Pivot Point S3 | 0.6600 |
| Daily Pivot Point R1 | 0.6820 |
| Daily Pivot Point R2 | 0.6887 |
| Daily Pivot Point R3 | 0.6930 |
[/s2If]
Join Our Telegram Group
")


