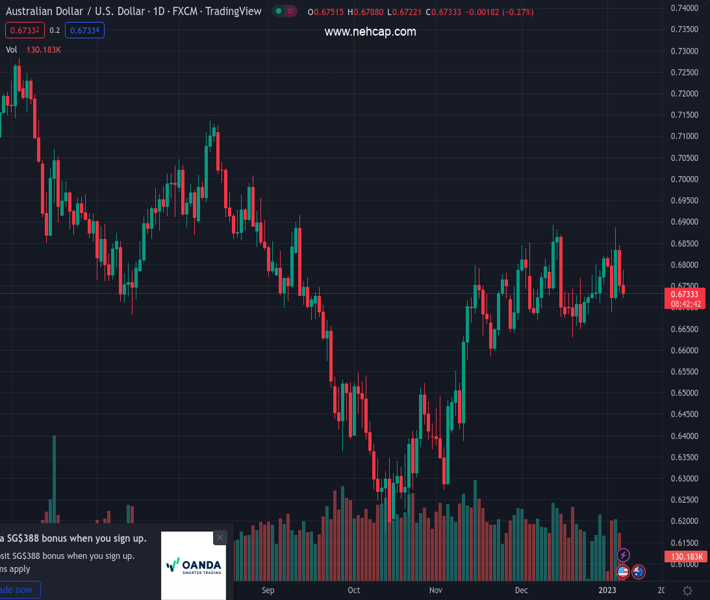
#AUDUSD @ 0.67342 turns lower for the second straight day amid strong follow-through USD buying. (Pivot Orderbook analysis)
…
This is a premium post.
[s2If !current_user_can(access_s2member_level4)]Please register for PREMIUM VERSION HERE to read full post below containing analysis. In case of any error or you think you are not able to read the full post below, please email us at support#nehcap.com [lwa][/s2If] [s2If current_user_can(access_s2member_level4)]
- AUD/USD turns lower for the second straight day amid strong follow-through USD buying.
- Thursday’s upbeat US macro data fuels hawkish Fed expectations and underpins the buck.
- Looming recession risks further benefit the safe-haven USD ahead of the crucial US NFP.
The pair currently trades last at 0.67342.
The previous day high was 0.6845 while the previous day low was 0.6735. The daily 38.2% Fib levels comes at 0.6777, expected to provide resistance. Similarly, the daily 61.8% fib level is at 0.6803, expected to provide resistance.
The AUD/USD pair attracts fresh selling following an early uptick to the 0.6800 neighbourhood and turns lower for the second successive day on Friday. The steady intraday descent drags spot prices to a fresh daily low, around the 0.6725-0.6720 region heading into the North American session and is sponsored by a strong follow-through US Dollar buying.
In fact, the USD Index, which measures the greenback’s performance against a basket of currencies, trades near a one-month high and continues to draw support from Thursday’s upbeat US macro data. The US ADP report on private-sector employment and an unexpected fall in Weekly Initial Jobless Claims pointed to a strong labour market, which could allow the Fed to stick to its aggressive rate hike path.
Apart from this, the prevalent cautious market mood further seems to benefit the safe-haven greenback and contributes to driving flows away from the risk-sensitive Australian Dollar. Despite the latest optimism over the easing of strict COVID-19 restrictions in China, concerns about a deeper global economic downturn weigh on the sentiment and tempers investors’ appetite for riskier assets.
It, however, remains to be seen if the USD bulls can maintain their dominant position as the focus shifts to the closely-watched US monthly jobs data. The popularly known NFP report could influence the Fed’s near-term policy outlook and play a key role in driving the USD demand. This, in turn, should assist investors to determine the next leg of a directional move for the AUD/USD pair.
Hence, it will be prudent to wait for strong follow-through selling before confirming that spot prices have topped out in the near term and positioning for any further depreciating move. Nevertheless, the AUD/USD pair remains on track to register losses for the first time in the previous three weeks.
Technical Levels: Supports and Resistances
AUDUSD currently trading at 0.6729 at the time of writing. Pair opened at 0.6752 and is trading with a change of -0.34 % .
| Overview | Overview.1 | |
|---|---|---|
| 0 | Today last price | 0.6729 |
| 1 | Today Daily Change | -0.0023 |
| 2 | Today Daily Change % | -0.3400 |
| 3 | Today daily open | 0.6752 |
The pair is trading below its 20 Daily moving average @ 0.675, above its 50 Daily moving average @ 0.6675 , above its 100 Daily moving average @ 0.6634 and below its 200 Daily moving average @ 0.6849
| Trends | Trends.1 | |
|---|---|---|
| 0 | Daily SMA20 | 0.6750 |
| 1 | Daily SMA50 | 0.6675 |
| 2 | Daily SMA100 | 0.6634 |
| 3 | Daily SMA200 | 0.6849 |
The previous day high was 0.6845 while the previous day low was 0.6735. The daily 38.2% Fib levels comes at 0.6777, expected to provide resistance. Similarly, the daily 61.8% fib level is at 0.6803, expected to provide resistance.
Note the levels of interest below:
- Pivot support is noted at 0.671, 0.6667, 0.66
- Pivot resistance is noted at 0.682, 0.6887, 0.693
| Levels | Levels.1 |
|---|---|
| Previous Daily High | 0.6845 |
| Previous Daily Low | 0.6735 |
| Previous Weekly High | 0.6821 |
| Previous Weekly Low | 0.6710 |
| Previous Monthly High | 0.6893 |
| Previous Monthly Low | 0.6629 |
| Daily Fibonacci 38.2% | 0.6777 |
| Daily Fibonacci 61.8% | 0.6803 |
| Daily Pivot Point S1 | 0.6710 |
| Daily Pivot Point S2 | 0.6667 |
| Daily Pivot Point S3 | 0.6600 |
| Daily Pivot Point R1 | 0.6820 |
| Daily Pivot Point R2 | 0.6887 |
| Daily Pivot Point R3 | 0.6930 |
[/s2If]
Join Our Telegram Group
")


