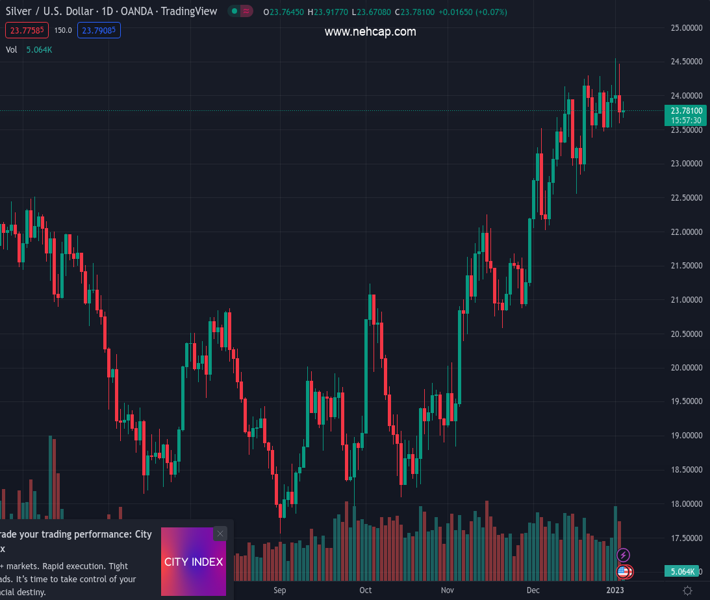
#XAGUSD @ 23.792 Silver struggles to gain any meaningful traction on Thursday and remains below the $24.00 mark. (Pivot Orderbook analysis)
…
This is a premium post.
[s2If !current_user_can(access_s2member_level4)]Please register for PREMIUM VERSION HERE to read full post below containing analysis. In case of any error or you think you are not able to read the full post below, please email us at support#nehcap.com [lwa][/s2If] [s2If current_user_can(access_s2member_level4)]
- Silver struggles to gain any meaningful traction on Thursday and remains below the $24.00 mark.
- The overnight break below two-month-old ascending trend-line support favours bearish traders.
- Mixed oscillators on hourly/daily charts warrant caution before positioning for a further decline.
The pair currently trades last at 23.792.
The previous day high was 24.46 while the previous day low was 23.59. The daily 38.2% Fib levels comes at 23.92, expected to provide resistance. Similarly, the daily 61.8% fib level is at 24.13, expected to provide resistance.
Silver struggles to capitalize on its modest intraday uptick and remains below the $24.00 round figure heading into the European session on Thursday. The technical set-up, meanwhile, supports prospects for a further pullback from over an eight-month high touched earlier this week.
The overnight break below a two-month-old ascending trend-line was seen as a fresh trigger for bearish traders. Furthermore, technical indicators on hourly charts have been drifting lower and add credence to the negative outlook. That said, oscillators on the daily chart – though have been losing traction – are yet to confirm a bearish bias. This makes it prudent to wait for some follow-through selling below the 100-period SMA on the 4-hour chart, currently around the $23.65 region, before positioning for any meaningful downside.
The XAG/USD might then accelerate the corrective fall towards testing sub-$23.00 levels. The downward trajectory could further get extended towards intermediate support near the $22.60-$22.55 region, below which spot prices could drop to the next relevant support near the $22.10-$22.00 horizontal zone. The latter should act as a strong base for the white metal, which if broken decisively will set the stage for an extension of the depreciating move.
On the flip side, the $24.00 round-figure mark now seems to act as an immediate hurdle ahead of the $24.25 area. This is followed by the multi-month high, around the $24.50-$24.55 region set on Tuesday. A sustained strength beyond the latter will negate any near-term negative outlook and allow the XAG/USD to reclaim the $25.00 psychological mark for the first time since April 2022.
Technical Levels: Supports and Resistances
XAGUSD currently trading at 23.78 at the time of writing. Pair opened at 23.78 and is trading with a change of 0.0 % .
| Overview | Overview.1 | |
|---|---|---|
| 0 | Today last price | 23.78 |
| 1 | Today Daily Change | 0.00 |
| 2 | Today Daily Change % | 0.00 |
| 3 | Today daily open | 23.78 |
The pair remains strongly bullish on the daily timeframe. It trades above its 20 SMA @ 23.65, 50 SMA 22.15, 100 SMA @ 20.63 and 200 SMA @ 21.11.
| Trends | Trends.1 | |
|---|---|---|
| 0 | Daily SMA20 | 23.65 |
| 1 | Daily SMA50 | 22.15 |
| 2 | Daily SMA100 | 20.63 |
| 3 | Daily SMA200 | 21.11 |
The previous day high was 24.46 while the previous day low was 23.59. The daily 38.2% Fib levels comes at 23.92, expected to provide resistance. Similarly, the daily 61.8% fib level is at 24.13, expected to provide resistance.
Note the levels of interest below:
- Pivot support is noted at 23.43, 23.07, 22.56
- Pivot resistance is noted at 24.3, 24.81, 25.16
| Levels | Levels.1 |
|---|---|
| Previous Daily High | 24.46 |
| Previous Daily Low | 23.59 |
| Previous Weekly High | 24.28 |
| Previous Weekly Low | 23.46 |
| Previous Monthly High | 24.30 |
| Previous Monthly Low | 22.03 |
| Daily Fibonacci 38.2% | 23.92 |
| Daily Fibonacci 61.8% | 24.13 |
| Daily Pivot Point S1 | 23.43 |
| Daily Pivot Point S2 | 23.07 |
| Daily Pivot Point S3 | 22.56 |
| Daily Pivot Point R1 | 24.30 |
| Daily Pivot Point R2 | 24.81 |
| Daily Pivot Point R3 | 25.16 |
[/s2If]
Join Our Telegram Group
")


