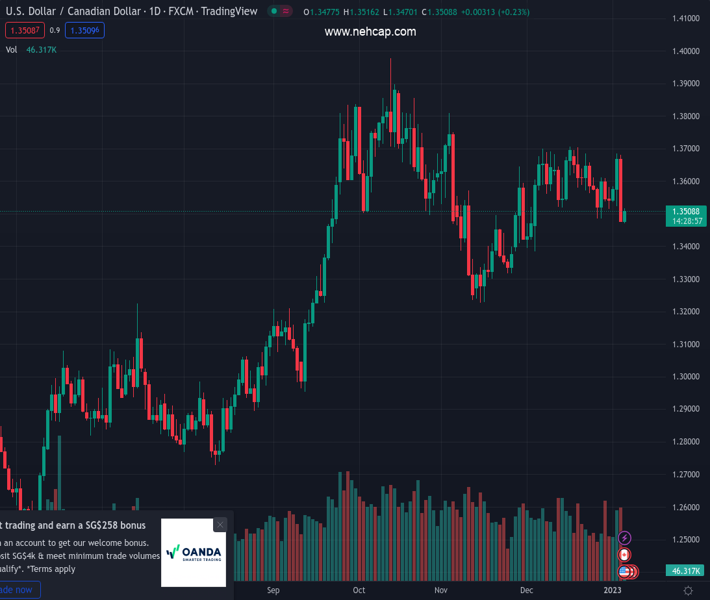
#USDCAD @ 1.35095 defends 100-day SMA and rebounds from a one-month low touched on Thursday. (Pivot Orderbook analysis)
…
This is a premium post.
[s2If !current_user_can(access_s2member_level4)]Please register for PREMIUM VERSION HERE to read full post below containing analysis. In case of any error or you think you are not able to read the full post below, please email us at support#nehcap.com [lwa][/s2If] [s2If current_user_can(access_s2member_level4)]
- USD/CAD defends 100-day SMA and rebounds from a one-month low touched on Thursday.
- Looming recession risks weigh on investors’ sentiment and benefit the safe-haven greenback.
- An uptick in oil prices could underpin the Loonie and cap any meaningful gains for the major.
The pair currently trades last at 1.35095.
The previous day high was 1.368 while the previous day low was 1.3476. The daily 38.2% Fib levels comes at 1.3554, expected to provide resistance. Similarly, the daily 61.8% fib level is at 1.3603, expected to provide resistance.
The USD/CAD pair attracts some buyers in the vicinity of the 100-day SMA support and stages a modest bounce from a one-month low touched earlier this Thursday. The pair sticks to its intraday recovery gains through the early European session and is currently placed just above the 1.3500 psychological mark.
A softer risk tone assists the safe-haven US Dollar to regain some positive traction, which, in turn, is seen pushing the USD/CAD pair higher. Despite the easing of strict COVID-19 curbs in China, concerns about a deeper global economic downturn continue to weigh on investors’ sentiment and keep a lid on any optimism in the markets. That said, a combination of factors might hold back the USD bulls from placing aggressive bets and cap the upside for the major, at least for the time being.
The minutes of the December FOMC policy meeting showed that officials unanimously supported raising borrowing costs at a slower pace. The prospect for smaller rate hikes by the Fed is reinforced by the fact that the US Treasury bond yields remain within the striking distance of a three-week low touched on Wednesday. This should act as a headwind for the USD. Apart from this, an uptick in crude oil prices might underpin the commodity-linked Loonie and warrants caution for the USD/CAD bulls.
Traders now look to the US economic docket, featuring the release of the ADP report on private-sector employment and the usual Weekly Initial Jobless Claims. This, along with the US bond yields and the broader risk sentiment, will drive the USD demand and provide some impetus to the USD/CAD pair. Apart from this, oil price dynamics could contribute to producing short-term trading opportunities. The focus, however, remains on monthly employment details from the US and Canada, due on Friday.
Technical Levels: Supports and Resistances
USDCAD currently trading at 1.351 at the time of writing. Pair opened at 1.3482 and is trading with a change of 0.21 % .
| Overview | Overview.1 | |
|---|---|---|
| 0 | Today last price | 1.3510 |
| 1 | Today Daily Change | 0.0028 |
| 2 | Today Daily Change % | 0.2100 |
| 3 | Today daily open | 1.3482 |
The pair is trading below its 20 Daily moving average @ 1.3598, below its 50 Daily moving average @ 1.3525 , above its 100 Daily moving average @ 1.3465 and above its 200 Daily moving average @ 1.3138
| Trends | Trends.1 | |
|---|---|---|
| 0 | Daily SMA20 | 1.3598 |
| 1 | Daily SMA50 | 1.3525 |
| 2 | Daily SMA100 | 1.3465 |
| 3 | Daily SMA200 | 1.3138 |
The previous day high was 1.368 while the previous day low was 1.3476. The daily 38.2% Fib levels comes at 1.3554, expected to provide resistance. Similarly, the daily 61.8% fib level is at 1.3603, expected to provide resistance.
Note the levels of interest below:
- Pivot support is noted at 1.3412, 1.3342, 1.3208
- Pivot resistance is noted at 1.3616, 1.375, 1.382
| Levels | Levels.1 |
|---|---|
| Previous Daily High | 1.3680 |
| Previous Daily Low | 1.3476 |
| Previous Weekly High | 1.3612 |
| Previous Weekly Low | 1.3484 |
| Previous Monthly High | 1.3705 |
| Previous Monthly Low | 1.3385 |
| Daily Fibonacci 38.2% | 1.3554 |
| Daily Fibonacci 61.8% | 1.3603 |
| Daily Pivot Point S1 | 1.3412 |
| Daily Pivot Point S2 | 1.3342 |
| Daily Pivot Point S3 | 1.3208 |
| Daily Pivot Point R1 | 1.3616 |
| Daily Pivot Point R2 | 1.3750 |
| Daily Pivot Point R3 | 1.3820 |
[/s2If]
Join Our Telegram Group
")


