Oil prices have sensed a moderate demand around $73.00 after carnage on Wednesday. (Pivot Orderbook analysis)
…
This is a premium post.
[s2If !current_user_can(access_s2member_level4)]Please register for PREMIUM VERSION HERE to read full post below containing analysis. In case of any error or you think you are not able to read the full post below, please email us at support#nehcap.com [lwa][/s2If] [s2If current_user_can(access_s2member_level4)]
- Oil prices have sensed a moderate demand around $73.00 after carnage on Wednesday.
- Bleak economic outlook led by sustainability of higher interest rates by the Fed impacts the black gold.
- Weaker manufacturing activities in the US consecutively for the second time have triggered recession fears.
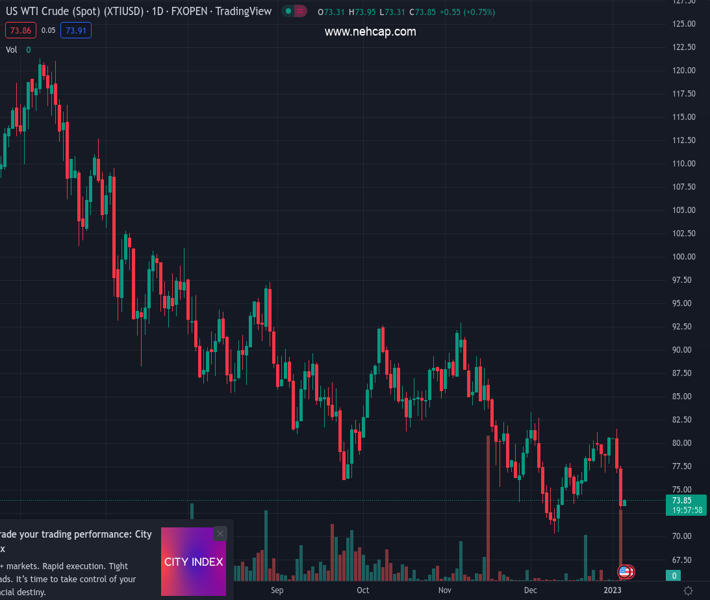
The pair currently trades last at 73.85.
The previous day high was 77.53 while the previous day low was 72.91. The daily 38.2% Fib levels comes at 74.68, expected to provide resistance. Similarly, the daily 61.8% fib level is at 75.77, expected to provide resistance.
West Texas Intermediate (WTI), futures on NYMEX, has picked some bids in the Asian session after crashing to near $73.00. The rebound move seems less-confident for now as oil prices witnessed a carnage on Wednesday led by a consecutive drop in United States Manufacturing PMI data reported by the Institute of Supply Management (ISM) department.
The Manufacturing PMI in the United States dropped to 48.4 vs. the expectations of 48.5 and the former release of 49.0, recorded as the lowest reading since May 2000. Aggressive policy tightening measures adopted by the Federal Reserve (Fed) to tackle the stubborn inflation has resulted in lower volume of manufacturing activities. Firms are dodging debt raising discussions to avoid higher interest obligations, which has led to unchanged production capacities and lower execution of investment opportunities.
Meanwhile, upbeat labor market in the United States is giving a meaningful reason to the Federal Reserve (Fed) to continue higher interest rates for a secular period. The Unemployment Rate is highly stable at lower levels and wage growth is strong, which is still keeping reins in the inflationary pressures.
Oil stockpiles reported by the American Petroleum Institute (API) have increased by 3.298 million barrels for the week ending December 30. Operational activities were majorly shut down as individuals were busy in New Year celebrations. Going forward, the US official oil inventory data will provide fresh impetus.
In the Asian domain, rising Covid infections in China is showing signs of delayed recovery in its economic prospects. Analysts at Rabobank are of the view that China is still trying to cope with the surge in Covid infections after restrictions were eased. “The recent surge in Covid infections is not only straining the Chinese health care system. Bloomberg reports that it may now also stifle Beijing’s plans to kick-start a domestic semiconductor industry to compete with US-controlled supply chains.
Technical Levels: Supports and Resistances
XTIUSD currently trading at 73.85 at the time of writing. Pair opened at 73.33 and is trading with a change of 0.71 % .
| Overview | Overview.1 | |
|---|---|---|
| 0 | Today last price | 73.85 |
| 1 | Today Daily Change | 0.52 |
| 2 | Today Daily Change % | 0.71 |
| 3 | Today daily open | 73.33 |
The pair remains strongly bearish on the daily time frame. It trades below the 20 SMA @ 76.83, 50 SMA 80.51, 100 SMA @ 83.41 and 200 SMA @ 93.31.
| Trends | Trends.1 | |
|---|---|---|
| 0 | Daily SMA20 | 76.83 |
| 1 | Daily SMA50 | 80.51 |
| 2 | Daily SMA100 | 83.41 |
| 3 | Daily SMA200 | 93.31 |
The previous day high was 77.53 while the previous day low was 72.91. The daily 38.2% Fib levels comes at 74.68, expected to provide resistance. Similarly, the daily 61.8% fib level is at 75.77, expected to provide resistance.
Note the levels of interest below:
- Pivot support is noted at 71.65, 69.97, 67.03
- Pivot resistance is noted at 76.28, 79.22, 80.9
| Levels | Levels.1 |
|---|---|
| Previous Daily High | 77.53 |
| Previous Daily Low | 72.91 |
| Previous Weekly High | 81.19 |
| Previous Weekly Low | 76.86 |
| Previous Monthly High | 83.30 |
| Previous Monthly Low | 70.27 |
| Daily Fibonacci 38.2% | 74.68 |
| Daily Fibonacci 61.8% | 75.77 |
| Daily Pivot Point S1 | 71.65 |
| Daily Pivot Point S2 | 69.97 |
| Daily Pivot Point S3 | 67.03 |
| Daily Pivot Point R1 | 76.28 |
| Daily Pivot Point R2 | 79.22 |
| Daily Pivot Point R3 | 80.90 |
[/s2If]
Join Our Telegram Group
")


