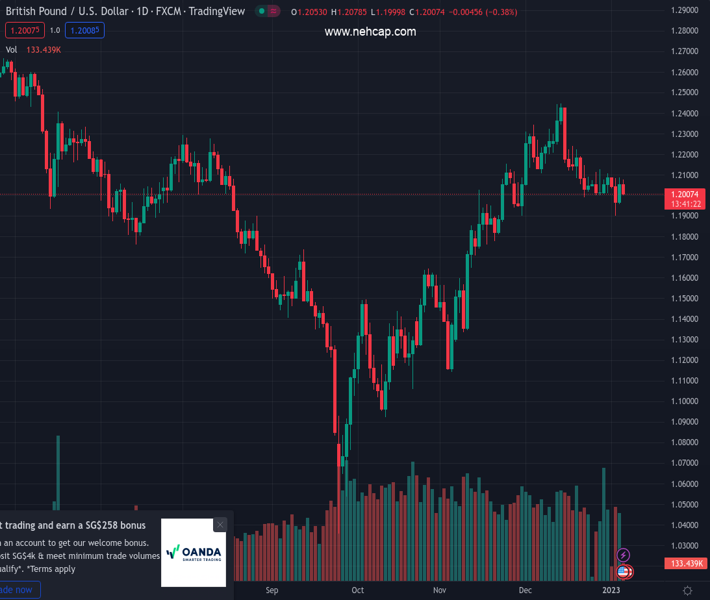
#GBPUSD @ 1.20082 comes under renewed selling pressure on Thursday amid a pickup in the USD demand. (Pivot Orderbook analysis)
…
This is a premium post.
[s2If !current_user_can(access_s2member_level4)]Please register for PREMIUM VERSION HERE to read full post below containing analysis. In case of any error or you think you are not able to read the full post below, please email us at support#nehcap.com [lwa][/s2If] [s2If current_user_can(access_s2member_level4)]
- GBP/USD comes under renewed selling pressure on Thursday amid a pickup in the USD demand.
- Recession fears weigh on investors’ sentiment and drive some haven flows towards the greenback.
- The Fed’s less hawkish outlook might keep a lid on the USD and limit deeper losses for the major.
The pair currently trades last at 1.20082.
The previous day high was 1.2088 while the previous day low was 1.1958. The daily 38.2% Fib levels comes at 1.2038, expected to provide resistance. Similarly, the daily 61.8% fib level is at 1.2007, expected to provide support.
The GBP/USD pair struggles to capitalize on the previous day’s positive move and attracts fresh sellers near the 1.2075-1.2080 region on Thursday. The steady intraday descent drags spot prices to the 1.2000 psychological mark during the early part of the European session and is sponsored by the emergence of some buying around the US Dollar.
Despite the easing of strict COVID-19 restrictions in China, concerns about a deeper global economic downturn continue to weigh on investors’ sentiment. This is evident from a fresh leg down in the US equity futures, which, in turn, is seen driving some haven flows towards the greenback and exerting downward pressure on the GBP/USD pair. That said, the prospects for smaller rate hikes by the Fed might hold back the USD bulls from placing aggressive bets and help limit losses for the major.
In fact, the minutes of the December FOMC policy meeting released on Wednesday showed that officials unanimously supported raising borrowing costs at a slower pace. The less hawkish outlook keeps the US Treasury bond yields depressed near a multi-week low, which could act as a headwind for the buck and lend some support to the GBP/USD pair. Traders might also prefer to move to the sidelines ahead of Friday’s release of the closely-watched US monthly jobs report – popularly known as NFP.
In the meantime, Thursday’s US economic docket, featuring the ADP report on private-sector employment, might provide some impetus to the GBP/USD pair later during the early North American session. This, along with the US bond yields and the broader risk sentiment, should influence the USD price dynamics and contribute to producing short-term opportunities heading into the key data risk.
Technical Levels: Supports and Resistances
GBPUSD currently trading at 1.2008 at the time of writing. Pair opened at 1.2059 and is trading with a change of -0.42 % .
| Overview | Overview.1 | |
|---|---|---|
| 0 | Today last price | 1.2008 |
| 1 | Today Daily Change | -0.0051 |
| 2 | Today Daily Change % | -0.4200 |
| 3 | Today daily open | 1.2059 |
The pair is trading below its 20 Daily moving average @ 1.2136, above its 50 Daily moving average @ 1.194 , above its 100 Daily moving average @ 1.1666 and below its 200 Daily moving average @ 1.203
| Trends | Trends.1 | |
|---|---|---|
| 0 | Daily SMA20 | 1.2136 |
| 1 | Daily SMA50 | 1.1940 |
| 2 | Daily SMA100 | 1.1666 |
| 3 | Daily SMA200 | 1.2030 |
The previous day high was 1.2088 while the previous day low was 1.1958. The daily 38.2% Fib levels comes at 1.2038, expected to provide resistance. Similarly, the daily 61.8% fib level is at 1.2007, expected to provide support.
Note the levels of interest below:
- Pivot support is noted at 1.1982, 1.1905, 1.1852
- Pivot resistance is noted at 1.2112, 1.2165, 1.2242
| Levels | Levels.1 |
|---|---|
| Previous Daily High | 1.2088 |
| Previous Daily Low | 1.1958 |
| Previous Weekly High | 1.2126 |
| Previous Weekly Low | 1.2002 |
| Previous Monthly High | 1.2447 |
| Previous Monthly Low | 1.1992 |
| Daily Fibonacci 38.2% | 1.2038 |
| Daily Fibonacci 61.8% | 1.2007 |
| Daily Pivot Point S1 | 1.1982 |
| Daily Pivot Point S2 | 1.1905 |
| Daily Pivot Point S3 | 1.1852 |
| Daily Pivot Point R1 | 1.2112 |
| Daily Pivot Point R2 | 1.2165 |
| Daily Pivot Point R3 | 1.2242 |
[/s2If]
Join Our Telegram Group
")


