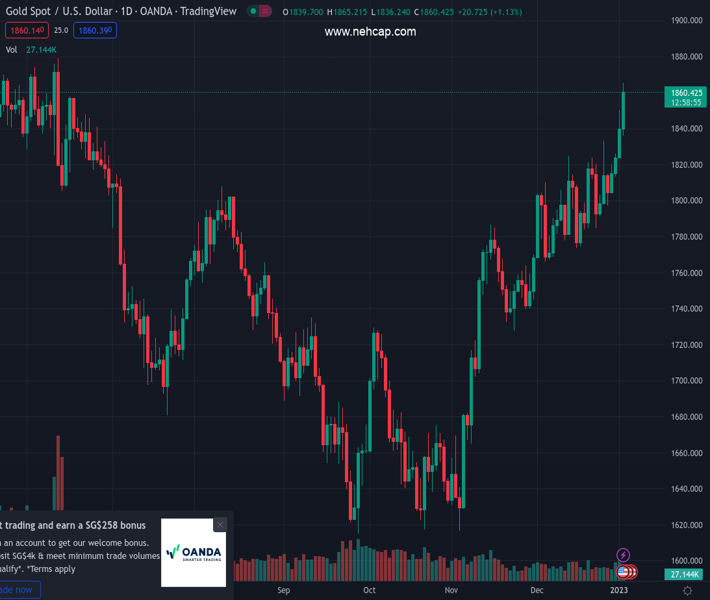
#XAUUSD @ 1,860.45 Gold price hits fresh seven-month highs above $1,860 in European trading. (Pivot Orderbook analysis)
…
This is a premium post.
[s2If !current_user_can(access_s2member_level4)]Please register for PREMIUM VERSION HERE to read full post below containing analysis. In case of any error or you think you are not able to read the full post below, please email us at support#nehcap.com [lwa][/s2If] [s2If current_user_can(access_s2member_level4)]
- Gold price hits fresh seven-month highs above $1,860 in European trading.
- The US Treasury yields decline, risk-on mood smash the US Dollar.
- Sell-off in the US Treasury yields cap the downside in the Gold price.
The pair currently trades last at 1860.45.
The previous day high was 1850.03 while the previous day low was 1824.7. The daily 38.2% Fib levels comes at 1840.35, expected to provide support. Similarly, the daily 61.8% fib level is at 1834.38, expected to provide support.
Gold price is holding close to the highest level in seven months above $1,860 in the Europen session, accelerating the upbeat momentum, as the US Dollar tumbled across the board following a hot start to 2023.
The US Dollar remains under heavy selling pressure, as the European equities opened higher. Further, the sell-off in the US Treasury bond yields gathered steam and exacerbated the pain in the greenback, allowing the non-yielding Gold price to extend its uptrend into the fourth straight session.
Markets continue to adjust their positions in the first week of this year, gearing up for the first top-tier US economic events release due later this Wednesday. The US ISM Manufacturing PMI and the US Federal Reserve (Fed) Minutes will be closely scrutinized for the Fed’s future policy path, which will significantly influence the US Dollar and the USD-sensitive yellow metal.
The fresh upsurge in the Gold price could be also attributed to the big technical breakout on the daily chart. Gold price confirmed an upside from the ascending triangle on Tuesday. The price closed Tuesday above the horizontal trendline (triangle) resistance at $1,825.
Technical Levels: Supports and Resistances
XAUUSD currently trading at 1860.88 at the time of writing. Pair opened at 1838.16 and is trading with a change of 1.23 % .
| Overview | Overview.1 | |
|---|---|---|
| 0 | Today last price | 1860.88 |
| 1 | Today Daily Change | 22.69 |
| 2 | Today Daily Change % | 1.23 |
| 3 | Today daily open | 1838.16 |
The pair remains strongly bullish on the daily timeframe. It trades above its 20 SMA @ 1803.06, 50 SMA 1757.02, 100 SMA @ 1724.08 and 200 SMA @ 1779.26.
| Trends | Trends.1 | |
|---|---|---|
| 0 | Daily SMA20 | 1803.06 |
| 1 | Daily SMA50 | 1757.02 |
| 2 | Daily SMA100 | 1724.08 |
| 3 | Daily SMA200 | 1779.26 |
The previous day high was 1850.03 while the previous day low was 1824.7. The daily 38.2% Fib levels comes at 1840.35, expected to provide support. Similarly, the daily 61.8% fib level is at 1834.38, expected to provide support.
Note the levels of interest below:
- Pivot support is noted at 1825.23, 1812.3, 1799.9
- Pivot resistance is noted at 1850.56, 1862.96, 1875.89
| Levels | Levels.1 |
|---|---|
| Previous Daily High | 1850.03 |
| Previous Daily Low | 1824.70 |
| Previous Weekly High | 1833.38 |
| Previous Weekly Low | 1797.11 |
| Previous Monthly High | 1833.38 |
| Previous Monthly Low | 1765.89 |
| Daily Fibonacci 38.2% | 1840.35 |
| Daily Fibonacci 61.8% | 1834.38 |
| Daily Pivot Point S1 | 1825.23 |
| Daily Pivot Point S2 | 1812.30 |
| Daily Pivot Point S3 | 1799.90 |
| Daily Pivot Point R1 | 1850.56 |
| Daily Pivot Point R2 | 1862.96 |
| Daily Pivot Point R3 | 1875.89 |
[/s2If]
Join Our Telegram Group
")


