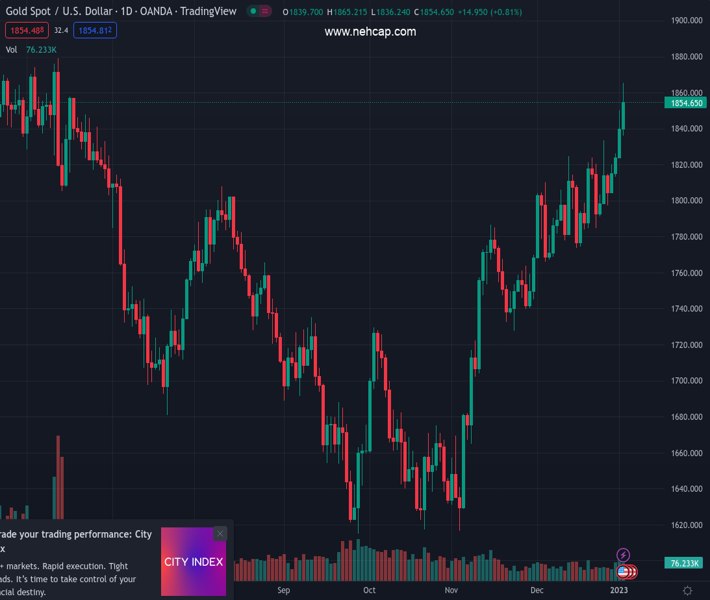
#XAUUSD @ 1,854.20 Gold price has comfortably shifted its business above $1,850.00 on weaker US Manufacturing PMI. (Pivot Orderbook analysis)
…
This is a premium post.
[s2If !current_user_can(access_s2member_level4)]Please register for PREMIUM VERSION HERE to read full post below containing analysis. In case of any error or you think you are not able to read the full post below, please email us at support#nehcap.com [lwa][/s2If] [s2If current_user_can(access_s2member_level4)]
- Gold price has comfortably shifted its business above $1,850.00 on weaker US Manufacturing PMI.
- The risk profile has turned positive as S&P500 sensed buying interest and US yields dropped further.
The pair currently trades last at 1854.20.
The previous day high was 1850.03 while the previous day low was 1824.7. The daily 38.2% Fib levels comes at 1840.35, expected to provide support. Similarly, the daily 61.8% fib level is at 1834.38, expected to provide support.
Gold price (XAU/USD) has picked buying interest after a corrective move to near the crucial support of $1,850.00 in the late New York session. The precious metal dropped after failing to sustain above $1,860.00, however, the corrective move is mild and is not showing any significant sign of reversal.
Risk-perceived assets like S&P500 witnessed a decent demand from the market participants after a decline in the United States Manufacturing PMI bolstered signs of further cool-off in the US Consumer Price Index (CPI). A decline in demand for goods might force firms to trim prices at factory goods to compensate for the former.
The US Dollar Index (DXY) dropped below the 104.00 support after 10-year US Treasury yields witnessed immense pressure and scaled down to near 3.69%. Safe-haven assets are facing pressure on expectations of further decline in the inflationary pressures. Federal Reserve (Fed) chair Jerome Powell shifted to a slowdown context in the extent of an interest rate hike in December after remaining aggressive for the entire year. No doubt, the inflation rate is still extremely far from the 2% target, however, the presence of catalysts that advocates further slowdown in the price index is weighing on safe-haven assets.
Gold price is attempting to deliver a breakout of the Rising Channel chart pattern on a four-hour scale. The precious metal has delivered a perpendicular rally after picking demand near the round-level support of $1,800.00. The 20-period Exponential Moving Average (EMA) at $1,839.11 is accelerating, which adds to the upside filters.
Meanwhile, the Relative Strength Index (RSI) (14) is oscillating in the bullish range of 60.00-80.00, which indicates that the upside momentum has been triggered.
Technical Levels: Supports and Resistances
XAUUSD currently trading at 1854.56 at the time of writing. Pair opened at 1838.16 and is trading with a change of 0.89 % .
| Overview | Overview.1 | |
|---|---|---|
| 0 | Today last price | 1854.56 |
| 1 | Today Daily Change | 16.40 |
| 2 | Today Daily Change % | 0.89 |
| 3 | Today daily open | 1838.16 |
The pair remains strongly bullish on the daily timeframe. It trades above its 20 SMA @ 1803.06, 50 SMA 1757.02, 100 SMA @ 1724.08 and 200 SMA @ 1779.26.
| Trends | Trends.1 | |
|---|---|---|
| 0 | Daily SMA20 | 1803.06 |
| 1 | Daily SMA50 | 1757.02 |
| 2 | Daily SMA100 | 1724.08 |
| 3 | Daily SMA200 | 1779.26 |
The previous day high was 1850.03 while the previous day low was 1824.7. The daily 38.2% Fib levels comes at 1840.35, expected to provide support. Similarly, the daily 61.8% fib level is at 1834.38, expected to provide support.
Note the levels of interest below:
- Pivot support is noted at 1825.23, 1812.3, 1799.9
- Pivot resistance is noted at 1850.56, 1862.96, 1875.89
| Levels | Levels.1 |
|---|---|
| Previous Daily High | 1850.03 |
| Previous Daily Low | 1824.70 |
| Previous Weekly High | 1833.38 |
| Previous Weekly Low | 1797.11 |
| Previous Monthly High | 1833.38 |
| Previous Monthly Low | 1765.89 |
| Daily Fibonacci 38.2% | 1840.35 |
| Daily Fibonacci 61.8% | 1834.38 |
| Daily Pivot Point S1 | 1825.23 |
| Daily Pivot Point S2 | 1812.30 |
| Daily Pivot Point S3 | 1799.90 |
| Daily Pivot Point R1 | 1850.56 |
| Daily Pivot Point R2 | 1862.96 |
| Daily Pivot Point R3 | 1875.89 |
[/s2If]
Join Our Telegram Group
")


