#XAUUSD @ 1,850.97 Gold prices are bolstered by an upbeat market sentiment keeping the US Dollar offered. (Pivot Orderbook analysis)
…
This is a premium post.
[s2If !current_user_can(access_s2member_level4)]Please register for PREMIUM VERSION HERE to read full post below containing analysis. In case of any error or you think you are not able to read the full post below, please email us at support#nehcap.com [lwa][/s2If] [s2If current_user_can(access_s2member_level4)]
- Gold prices are bolstered by an upbeat market sentiment keeping the US Dollar offered.
- Investors cheered China’s planning to support the property market and the relaxation of its Covid zero-tolerance policy.
- A busy US economic docket keeps traders wary of propelling the US Dollar.
- Minnesota Fed Kashkari: The Fed must avoid cutting rates prematurely.
The pair currently trades last at 1850.97.
The previous day high was 1850.03 while the previous day low was 1824.7. The daily 38.2% Fib levels comes at 1840.35, expected to provide support. Similarly, the daily 61.8% fib level is at 1834.38, expected to provide support.
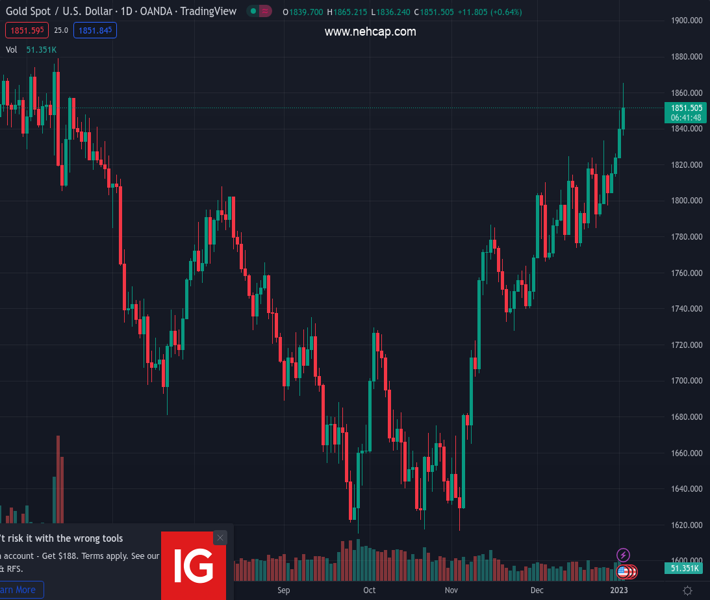
Gold price rallied to eight-month highs around $1,865.15, though slightly retraced some of its gains amidst an upbeat market sentiment, spurred by China’s support to its housing market, alongside its border reopening, as it relaxes Covid-19 zero-tolerance measures. Investors get ready for a busy economic calendar in the United States (US), while Federal Reserve’s (Fed) officials began to cross newswires. At the time of writing, the XAU/USD is trading at $1,856.01, above its opening price by 1%.
Wall Street is poised to open higher, as shown by equity futures rising, while the US Dollar (USD) weakens. Factors like Chinese authorities planning to deliver additional support to property developers, aimed to relax liquidity stress in some “too-big-to-fail” developers, sparked a rally in Asian stocks. Meanwhile, China’s reopening was cheered by investors, even though the country reported 5 Covid deaths on January 3, vs. three from the previous day.
Aside from this, investors waiting for US economic data has bolstered Gold prices, as Tuesday’s US Dollar longs exited ahead of market-moving data. Following the S&P Global Manufacturing PMI release on Tuesday, the Institute for Supply Management (ISM) for December is expected to drop from 49.0 to 48.5. Also, the JOLTs report is estimated to hit 10 M, vs. 10.334M in the previous month, while the main spotlight would be the release of the Federal Open Market Committee (FOMC) December meeting minutes.
In the meantime, Minnesota’s Fed President Neil Kashkari (voter in 2023) said that it would be appropriate to continue to hike rates “at least at the next few meetings” until inflation has peaked and foresees the Federal Funds rate (FFR) at 5.4%. He added that the Fed must avoid cutting the policy rate prematurely and would consider cutting only when it’s convinced inflation is on its way back down to 2%.
Technical Levels: Supports and Resistances
XAUUSD currently trading at 1857.12 at the time of writing. Pair opened at 1838.16 and is trading with a change of 1.03 % .
| Overview | Overview.1 | |
|---|---|---|
| 0 | Today last price | 1857.12 |
| 1 | Today Daily Change | 18.96 |
| 2 | Today Daily Change % | 1.03 |
| 3 | Today daily open | 1838.16 |
The pair remains strongly bullish on the daily timeframe. It trades above its 20 SMA @ 1803.06, 50 SMA 1757.02, 100 SMA @ 1724.08 and 200 SMA @ 1779.26.
| Trends | Trends.1 | |
|---|---|---|
| 0 | Daily SMA20 | 1803.06 |
| 1 | Daily SMA50 | 1757.02 |
| 2 | Daily SMA100 | 1724.08 |
| 3 | Daily SMA200 | 1779.26 |
The previous day high was 1850.03 while the previous day low was 1824.7. The daily 38.2% Fib levels comes at 1840.35, expected to provide support. Similarly, the daily 61.8% fib level is at 1834.38, expected to provide support.
Note the levels of interest below:
- Pivot support is noted at 1825.23, 1812.3, 1799.9
- Pivot resistance is noted at 1850.56, 1862.96, 1875.89
| Levels | Levels.1 |
|---|---|
| Previous Daily High | 1850.03 |
| Previous Daily Low | 1824.70 |
| Previous Weekly High | 1833.38 |
| Previous Weekly Low | 1797.11 |
| Previous Monthly High | 1833.38 |
| Previous Monthly Low | 1765.89 |
| Daily Fibonacci 38.2% | 1840.35 |
| Daily Fibonacci 61.8% | 1834.38 |
| Daily Pivot Point S1 | 1825.23 |
| Daily Pivot Point S2 | 1812.30 |
| Daily Pivot Point S3 | 1799.90 |
| Daily Pivot Point R1 | 1850.56 |
| Daily Pivot Point R2 | 1862.96 |
| Daily Pivot Point R3 | 1875.89 |
[/s2If]
Join Our Telegram Group
")


