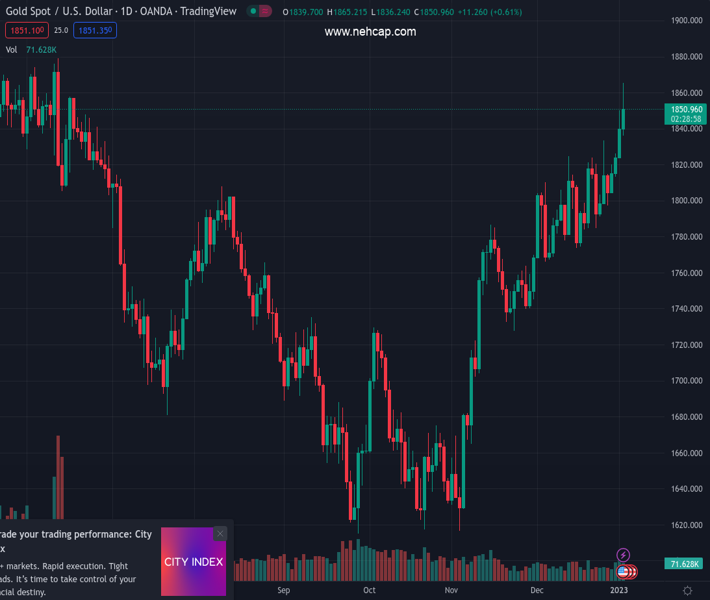
#XAUUSD @ 1,850.94 Gold reacted downwards towards the low $1,840s on the release. (Pivot Orderbook analysis)
…
This is a premium post.
[s2If !current_user_can(access_s2member_level4)]Please register for PREMIUM VERSION HERE to read full post below containing analysis. In case of any error or you think you are not able to read the full post below, please email us at support#nehcap.com [lwa][/s2If] [s2If current_user_can(access_s2member_level4)]
- Gold reacted downwards towards the low $1,840s on the release.
- FOMC: Officials do not expect to cut rates in 2023.
- FOMC: Policymakers did not express the size for further rate hikes.
The pair currently trades last at 1850.94.
The previous day high was 1850.03 while the previous day low was 1824.7. The daily 38.2% Fib levels comes at 1840.35, expected to provide support. Similarly, the daily 61.8% fib level is at 1834.38, expected to provide support.
Gold price clings to gains around $1850 following the release of the Federal Reserve’s Open Market Committee (FOMC) minutes for the last meeting, which emphasized the need for the central bank to tighten conditions amid stubbornly high inflation levels. At the time of writing, the XAG/USD is trading at around $1,850.
The December minutes showed that policymakers agreed to slow the pace of interest rate hikes but added that a slowdown is not a “weakening commitment to achieving price stability on that inflation is already on a persistent downward path.” Fed officials added that the US central bank had made significant progress in moving to restrictive policies and added that no rate cuts would be necessary for 2023.
Additionally, policymakers added that inflation risks could be more persistent and that further increases to the Federal Funds rate (FFR) would be appropriate.
The US Dollar Index (DXY) headed towards 104.409 but retraced some of its gains. The XAU/USD slumped below $1,850, extending its drop towards $1,843, though, at the time of typing, it seesaws around the $1,850 figure.
Regarding US Treasury bond yields, which play a big part in XAU/USD’s direction, the 10-year benchmark note rate sits at 3.709%, falling three and a half bps during the day. Therefore, if XAU/USD holds to gains above $1,850, that could pave the way for a test of $1,900.
Technical Levels: Supports and Resistances
XAUUSD currently trading at 1850.43 at the time of writing. Pair opened at 1838.16 and is trading with a change of 0.67 % .
| Overview | Overview.1 | |
|---|---|---|
| 0 | Today last price | 1850.43 |
| 1 | Today Daily Change | 12.27 |
| 2 | Today Daily Change % | 0.67 |
| 3 | Today daily open | 1838.16 |
The pair remains strongly bullish on the daily timeframe. It trades above its 20 SMA @ 1803.06, 50 SMA 1757.02, 100 SMA @ 1724.08 and 200 SMA @ 1779.26.
| Trends | Trends.1 | |
|---|---|---|
| 0 | Daily SMA20 | 1803.06 |
| 1 | Daily SMA50 | 1757.02 |
| 2 | Daily SMA100 | 1724.08 |
| 3 | Daily SMA200 | 1779.26 |
The previous day high was 1850.03 while the previous day low was 1824.7. The daily 38.2% Fib levels comes at 1840.35, expected to provide support. Similarly, the daily 61.8% fib level is at 1834.38, expected to provide support.
Note the levels of interest below:
- Pivot support is noted at 1825.23, 1812.3, 1799.9
- Pivot resistance is noted at 1850.56, 1862.96, 1875.89
| Levels | Levels.1 |
|---|---|
| Previous Daily High | 1850.03 |
| Previous Daily Low | 1824.70 |
| Previous Weekly High | 1833.38 |
| Previous Weekly Low | 1797.11 |
| Previous Monthly High | 1833.38 |
| Previous Monthly Low | 1765.89 |
| Daily Fibonacci 38.2% | 1840.35 |
| Daily Fibonacci 61.8% | 1834.38 |
| Daily Pivot Point S1 | 1825.23 |
| Daily Pivot Point S2 | 1812.30 |
| Daily Pivot Point S3 | 1799.90 |
| Daily Pivot Point R1 | 1850.56 |
| Daily Pivot Point R2 | 1862.96 |
| Daily Pivot Point R3 | 1875.89 |
[/s2If]
Join Our Telegram Group
")


