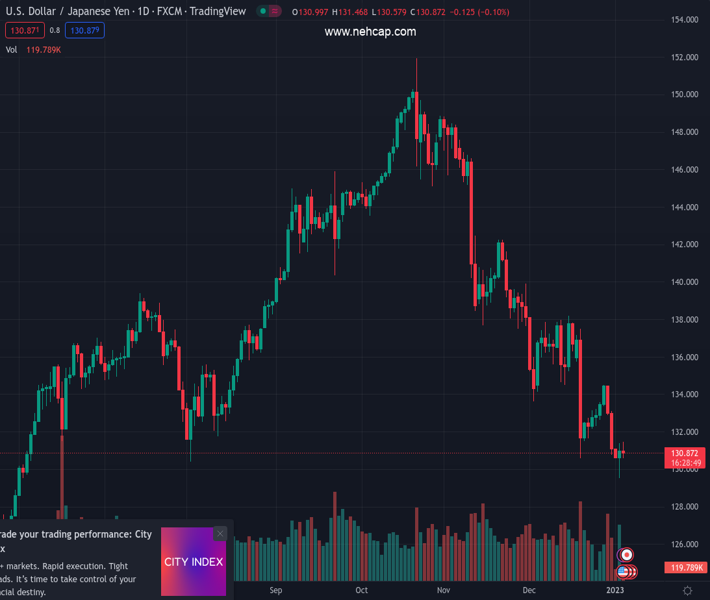
#USDJPY @ 130.893 is struggling to extend its recovery above 131.00. (Pivot Orderbook analysis)
…
This is a premium post.
[s2If !current_user_can(access_s2member_level4)]Please register for PREMIUM VERSION HERE to read full post below containing analysis. In case of any error or you think you are not able to read the full post below, please email us at support#nehcap.com [lwa][/s2If] [s2If current_user_can(access_s2member_level4)]
- USD/JPY is struggling to extend its recovery above 131.00.
- A spree of lower highs in the asset indicates a continuation of the downside trend.
- Downward-sloping 20-and 50-EMAs add to the downside filters.
The pair currently trades last at 130.893.
The previous day high was 131.4 while the previous day low was 129.51. The daily 38.2% Fib levels comes at 130.68, expected to provide support. Similarly, the daily 61.8% fib level is at 130.23, expected to provide support.
The USD/JPY pair is struggling to extend its recovery above 131.00 in the early European session. Earlier, the asset rebounded after sensing buying interest around 129.50 as investors underpinned the US Dollar amid a risk-off market mood.
The US Dollar Index (DXY) is displaying a subdued performance as investors are awaiting a fresh trigger for a decisive move.
On a four-hour scale, one could easily identify the continuation of the downtrend and the absence of any recovery move from the US Dollar. The Relative Strength Index (RSI) (14) is constantly failing to overstep 60.00, which indicates the presence of a ‘sell on rise’ context in the trading activity.
Apart from that, downward-sloping 20-and 50-period Exponential Moving Averages (EMAs) at 131.15 and 132.15 indicates more weakness ahead.
It would be prudent to wait for a pullback move to near the 50-period EMA around 132.15 for building a short position, which will drag the asset toward the psychological resistance at 130.00 followed by May 4 low at 128.63.
On the flip side, a rebound move above December 29 high at 134.50 will drive the asset towards December 7 low around 134.00. A breach above the latter will send the asset towards December 20 high at 137.47.
Technical Levels: Supports and Resistances
USDJPY currently trading at 130.82 at the time of writing. Pair opened at 130.96 and is trading with a change of -0.11 % .
| Overview | Overview.1 | |
|---|---|---|
| 0 | Today last price | 130.82 |
| 1 | Today Daily Change | -0.14 |
| 2 | Today Daily Change % | -0.11 |
| 3 | Today daily open | 130.96 |
The pair remains strongly bearish on the daily time frame. It trades below the 20 SMA @ 134.3, 50 SMA 138.86, 100 SMA @ 141.04 and 200 SMA @ 136.3.
| Trends | Trends.1 | |
|---|---|---|
| 0 | Daily SMA20 | 134.30 |
| 1 | Daily SMA50 | 138.86 |
| 2 | Daily SMA100 | 141.04 |
| 3 | Daily SMA200 | 136.30 |
The previous day high was 131.4 while the previous day low was 129.51. The daily 38.2% Fib levels comes at 130.68, expected to provide support. Similarly, the daily 61.8% fib level is at 130.23, expected to provide support.
Note the levels of interest below:
- Pivot support is noted at 129.85, 128.73, 127.95
- Pivot resistance is noted at 131.74, 132.52, 133.63
| Levels | Levels.1 |
|---|---|
| Previous Daily High | 131.40 |
| Previous Daily Low | 129.51 |
| Previous Weekly High | 134.50 |
| Previous Weekly Low | 130.78 |
| Previous Monthly High | 138.18 |
| Previous Monthly Low | 130.57 |
| Daily Fibonacci 38.2% | 130.68 |
| Daily Fibonacci 61.8% | 130.23 |
| Daily Pivot Point S1 | 129.85 |
| Daily Pivot Point S2 | 128.73 |
| Daily Pivot Point S3 | 127.95 |
| Daily Pivot Point R1 | 131.74 |
| Daily Pivot Point R2 | 132.52 |
| Daily Pivot Point R3 | 133.63 |
[/s2If]
Join Our Telegram Group
")


