#USDCHF @ 0.92896 failed to crack above 0.9400, exacerbating a fall beneath 0.9300. (Pivot Orderbook analysis)
…
This is a premium post.
[s2If !current_user_can(access_s2member_level4)]Please register for PREMIUM VERSION HERE to read full post below containing analysis. In case of any error or you think you are not able to read the full post below, please email us at support#nehcap.com [lwa][/s2If] [s2If current_user_can(access_s2member_level4)]
- USD/CHF failed to crack above 0.9400, exacerbating a fall beneath 0.9300.
- US Dollar weakness and the confluence of technical levels around 0.9370s stalled the USD/CHF rally.
- A daily close above 0.9250 could lift the USD/CHF back again, towards 0.9300.
The pair currently trades last at 0.92896.
The previous day high was 0.9399 while the previous day low was 0.923. The daily 38.2% Fib levels comes at 0.9334, expected to provide resistance. Similarly, the daily 61.8% fib level is at 0.9294, expected to provide resistance.
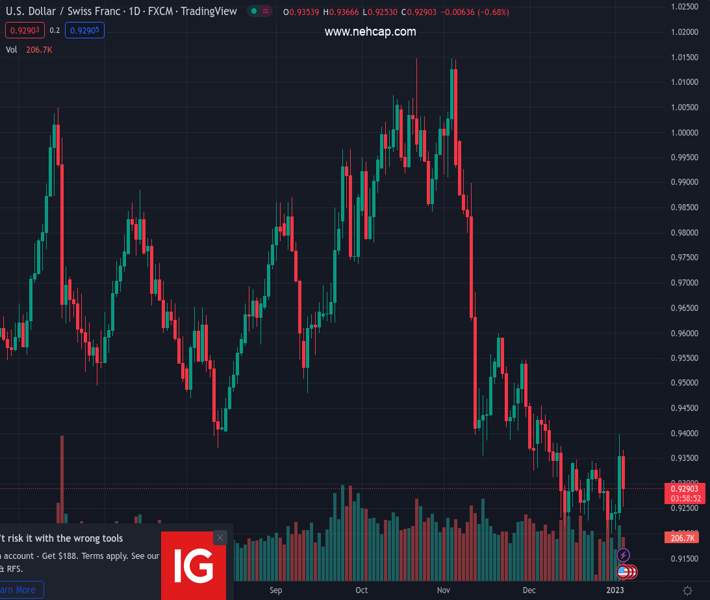
The USD/CHF struggles to clear the 0.9370 barrier, dives below the 20-day Exponential Moving Average (EMA), and the 0.9300 figure as the US Dollar (USD) weakens. The USD/CHF is trading at 0.9279, below its opening price by 0.80%.
After reaching a weekly high at around 0.9398 on Wednesday, the USD/CHF shifted gears and snapped three days of gains. The USD/CHF dived below the 20-day EMA, which sits at 0.9317, extending its fall toward its daily lows of 0.9253, but solid support around the latter spurred a slight jump to the current exchange rates.
The Relative Strength Index (RSI) failed to crack its midline and remained at bearish territory, exacerbating today’s fall. The Rate of Change (RoC) flashes sellers gathering some momentum. However, the top trendline of a falling wedge, a bullish chart pattern that emerged in the USD/CHF daily chart, stalled the drop. Therefore, the USD/CHF might remain range-bound.
The USD/CHF key support levels would be the 0.9250 figure, followed by the 0.9200 mark. As an alternate scenario, the USD/CHF first resistance would be 0.9300, followed by the weekly high of 0.9398, ahead of the 0.9400 mark.
Technical Levels: Supports and Resistances
USDCHF currently trading at 0.9271 at the time of writing. Pair opened at 0.936 and is trading with a change of -0.95 % .
| Overview | Overview.1 | |
|---|---|---|
| 0 | Today last price | 0.9271 |
| 1 | Today Daily Change | -0.0089 |
| 2 | Today Daily Change % | -0.9500 |
| 3 | Today daily open | 0.9360 |
The pair remains strongly bearish on the daily time frame. It trades below the 20 SMA @ 0.9306, 50 SMA 0.951, 100 SMA @ 0.9651 and 200 SMA @ 0.9644.
| Trends | Trends.1 | |
|---|---|---|
| 0 | Daily SMA20 | 0.9306 |
| 1 | Daily SMA50 | 0.9510 |
| 2 | Daily SMA100 | 0.9651 |
| 3 | Daily SMA200 | 0.9644 |
The previous day high was 0.9399 while the previous day low was 0.923. The daily 38.2% Fib levels comes at 0.9334, expected to provide resistance. Similarly, the daily 61.8% fib level is at 0.9294, expected to provide resistance.
Note the levels of interest below:
- Pivot support is noted at 0.926, 0.9161, 0.9092
- Pivot resistance is noted at 0.9429, 0.9498, 0.9597
| Levels | Levels.1 |
|---|---|
| Previous Daily High | 0.9399 |
| Previous Daily Low | 0.9230 |
| Previous Weekly High | 0.9338 |
| Previous Weekly Low | 0.9201 |
| Previous Monthly High | 0.9471 |
| Previous Monthly Low | 0.9201 |
| Daily Fibonacci 38.2% | 0.9334 |
| Daily Fibonacci 61.8% | 0.9294 |
| Daily Pivot Point S1 | 0.9260 |
| Daily Pivot Point S2 | 0.9161 |
| Daily Pivot Point S3 | 0.9092 |
| Daily Pivot Point R1 | 0.9429 |
| Daily Pivot Point R2 | 0.9498 |
| Daily Pivot Point R3 | 0.9597 |
[/s2If]
Join Our Telegram Group
")


