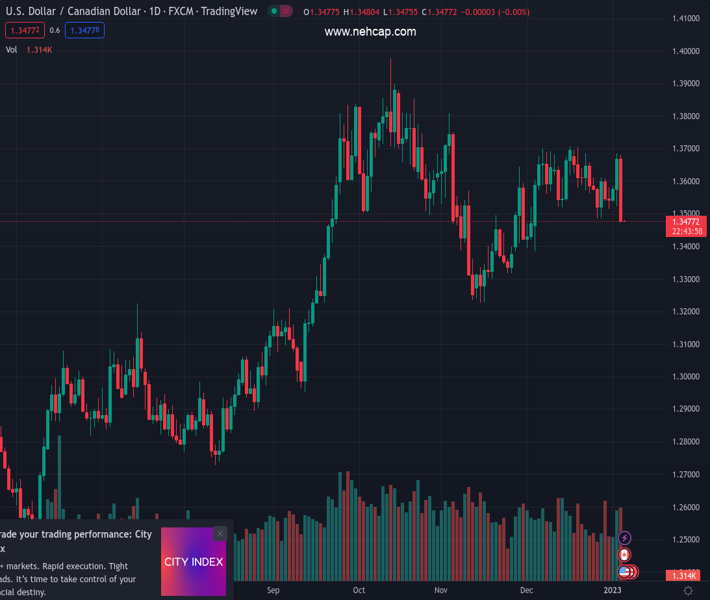
#USDCAD @ 1.34774 has exposed to drop to near 1.3450 amid weak US Treasury yields. (Pivot Orderbook analysis)
…
This is a premium post.
[s2If !current_user_can(access_s2member_level4)]Please register for PREMIUM VERSION HERE to read full post below containing analysis. In case of any error or you think you are not able to read the full post below, please email us at support#nehcap.com [lwa][/s2If] [s2If current_user_can(access_s2member_level4)]
- USD/CAD has exposed to drop to near 1.3450 amid weak US Treasury yields.
- Investors will keep an eye on US/Canada Employment data for fresh cues.
- Oil prices drop below $74.00 amid short-term pain in China’s prospects due to rising Covid cases.
The pair currently trades last at 1.34774.
The previous day high was 1.3685 while the previous day low was 1.3523. The daily 38.2% Fib levels comes at 1.3623, expected to provide resistance. Similarly, the daily 61.8% fib level is at 1.3585, expected to provide resistance.
The USD/CAD pair has surrendered the crucial support of 1.3486 in the Asian session after a vertical sell-off from above 1.3650 on Wednesday. The downside pressure in the Loonie asset is bolstering the expression of extension in the south-side journey towards 1.3450 ahead. The US Dollar witnessed a steep fall following the footprints of weaker US Treasury yields.
Investors’ risk appetite has improved dramatically after the release of the downbeat United States ISM Manufacturing PMI. S&P500 witnessed demand from the market participants as various factors are now signaling for further inflation softening ahead.
The US Dollar Index (DXY) reacted less to the release of the Federal Open Market Committee (FOMC) minutes as it seems it was already discounted. None of the Federal Reserve (Fed) policymakers voted against the decision of easing the pace of interest rate hike to 50 basis points (bps) amid evidence of a slowdown in the Consumer Price Index (CPI).
Going forward, investors will focus on the release of the US Nonfarm Payrolls (NFP) data, which will release on Friday. As per the consensus, the United States economy added 200K fresh jobs in December vs. the former release of 263K. The Unemployment Rate is likely to remain steady at 3.7%. Apart from that, the Average Hourly Earnings could drop to 5.0% from 5.1% released earlier.
Meanwhile, the Canadian Dollar will also dance to the tunes of Employment data. According to the estimates, net addition in payrolls for December stands at 8K against 10.1K released earlier. The jobless rate will escalate marginally to 5.2%.
On the oil front, oil prices have dropped further below $74.00 as short-term pain in China’s economic prospects led by accelerating Covid infections is hurting oil demand prospects. It is worth noting that Canada is a leading exporter of oil to the United States and lower oil prices could weaken the Canadian Dollar.
Technical Levels: Supports and Resistances
USDCAD currently trading at 1.3481 at the time of writing. Pair opened at 1.367 and is trading with a change of -1.38 % .
| Overview | Overview.1 | |
|---|---|---|
| 0 | Today last price | 1.3481 |
| 1 | Today Daily Change | -0.0189 |
| 2 | Today Daily Change % | -1.3800 |
| 3 | Today daily open | 1.3670 |
The pair is trading below its 20 Daily moving average @ 1.3607, below its 50 Daily moving average @ 1.3526 , above its 100 Daily moving average @ 1.3459 and above its 200 Daily moving average @ 1.3133
| Trends | Trends.1 | |
|---|---|---|
| 0 | Daily SMA20 | 1.3607 |
| 1 | Daily SMA50 | 1.3526 |
| 2 | Daily SMA100 | 1.3459 |
| 3 | Daily SMA200 | 1.3133 |
The previous day high was 1.3685 while the previous day low was 1.3523. The daily 38.2% Fib levels comes at 1.3623, expected to provide resistance. Similarly, the daily 61.8% fib level is at 1.3585, expected to provide resistance.
Note the levels of interest below:
- Pivot support is noted at 1.3566, 1.3463, 1.3404
- Pivot resistance is noted at 1.3729, 1.3788, 1.3891
| Levels | Levels.1 |
|---|---|
| Previous Daily High | 1.3685 |
| Previous Daily Low | 1.3523 |
| Previous Weekly High | 1.3612 |
| Previous Weekly Low | 1.3484 |
| Previous Monthly High | 1.3705 |
| Previous Monthly Low | 1.3385 |
| Daily Fibonacci 38.2% | 1.3623 |
| Daily Fibonacci 61.8% | 1.3585 |
| Daily Pivot Point S1 | 1.3566 |
| Daily Pivot Point S2 | 1.3463 |
| Daily Pivot Point S3 | 1.3404 |
| Daily Pivot Point R1 | 1.3729 |
| Daily Pivot Point R2 | 1.3788 |
| Daily Pivot Point R3 | 1.3891 |
[/s2If]
Join Our Telegram Group
")


