The US Dollar Index is looking to surpass the 104.40 hurdle amid negative market sentiment. (Pivot Orderbook analysis)
…
This is a premium post.
[s2If !current_user_can(access_s2member_level4)]Please register for PREMIUM VERSION HERE to read full post below containing analysis. In case of any error or you think you are not able to read the full post below, please email us at support#nehcap.com [lwa][/s2If] [s2If current_user_can(access_s2member_level4)]
- The US Dollar Index is looking to surpass the 104.40 hurdle amid negative market sentiment.
- Investors are expecting cues of hawkish policy guidance for CY2023 in FOMC minutes.
- The release of the US ISM Manufacturing PMI is expected to bring a power-pack action in the US Dollar.
The pair currently trades last at 104.55.
The previous day high was 104.86 while the previous day low was 103.47. The daily 38.2% Fib levels comes at 104.33, expected to provide support. Similarly, the daily 61.8% fib level is at 104.0, expected to provide support.
The US Dollar Index (DXY) is showing signs of volatility contraction around the critical hurdle of 104.40 in the Asian session. The USD Index is likely to escalate its upside journey further as negative market sentiment ahead of the Federal Open Market Committee (FOMC) minutes and the United States ISM Manufacturing PMI data has improved the safe-haven’s appeal.
S&P500 continued its subdued performance on Tuesday as investors expect a hawkish policy outlook from FOMC minutes. The return on 10-year US Treasury bonds dropped to 3.76%.
Investors are getting precautionary as the tight labor market in the United States could make the inflationary pressures more stubborn ahead. Rising demand for labor would be compensated by higher wage growth that could propel the price index further. Things would get clear after the release of the FOMC minutes, which will provide a monetary policy outlook for CY2022. Apart from that, a detailed explanation behind the 50 basis points (bps) interest rate hike by Fed chair Jerome Powell in December’s meeting and a wide statement on economic prospects will be of utmost importance.
This week, the release of the FOMC minutes will be the key trigger, but before that, investors will focus on the release of the US ISM Manufacturing PMI, which is scheduled for Wednesday. The economic data is likely to decline to at 48.5 vs. the former release of 49.0. A drop in investment decisions and expansion plans in current capacity due to interest rates by the Fed is impacting the volume of manufacturing activities. Also, a decline in retail demand has trimmed supply from factory gates.
Apart from the Manufacturing PMI, the catalyst that will impact the US Dollar is the New Orders Index, which is expected to improve to 48.1 vs. the former release of 47.2.
Technical Levels: Supports and Resistances
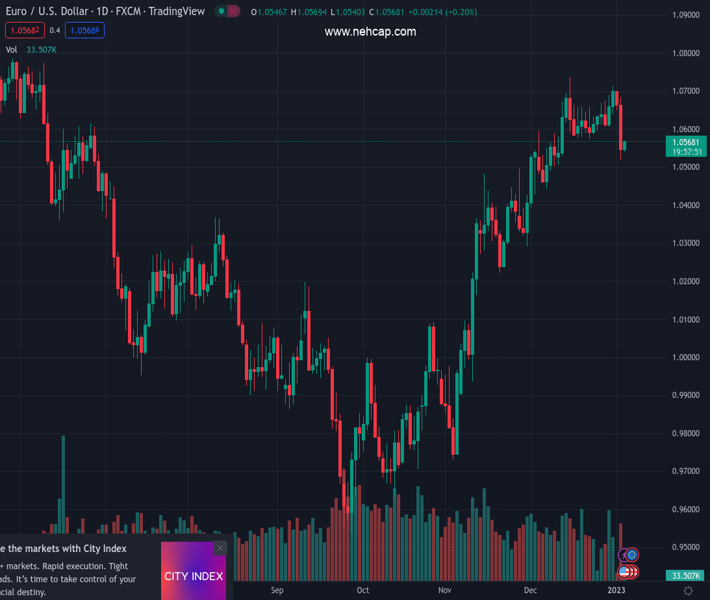
EURUSD currently trading at 104.55 at the time of writing. Pair opened at 104.68 and is trading with a change of -0.12 % .
| Overview | Overview.1 | |
|---|---|---|
| 0 | Today last price | 104.55 |
| 1 | Today Daily Change | -0.13 |
| 2 | Today Daily Change % | -0.12 |
| 3 | Today daily open | 104.68 |
The pair is trading above its 20 Daily moving average @ 104.37, below its 50 Daily moving average @ 105.53 , below its 100 Daily moving average @ 108.45 and below its 200 Daily moving average @ 106.73
| Trends | Trends.1 | |
|---|---|---|
| 0 | Daily SMA20 | 104.37 |
| 1 | Daily SMA50 | 105.53 |
| 2 | Daily SMA100 | 108.45 |
| 3 | Daily SMA200 | 106.73 |
The previous day high was 104.86 while the previous day low was 103.47. The daily 38.2% Fib levels comes at 104.33, expected to provide support. Similarly, the daily 61.8% fib level is at 104.0, expected to provide support.
Note the levels of interest below:
- Pivot support is noted at 103.81, 102.94, 102.42
- Pivot resistance is noted at 105.21, 105.73, 106.6
| Levels | Levels.1 |
|---|---|
| Previous Daily High | 104.86 |
| Previous Daily Low | 103.47 |
| Previous Weekly High | 104.56 |
| Previous Weekly Low | 103.39 |
| Previous Monthly High | 106.02 |
| Previous Monthly Low | 103.39 |
| Daily Fibonacci 38.2% | 104.33 |
| Daily Fibonacci 61.8% | 104.00 |
| Daily Pivot Point S1 | 103.81 |
| Daily Pivot Point S2 | 102.94 |
| Daily Pivot Point S3 | 102.42 |
| Daily Pivot Point R1 | 105.21 |
| Daily Pivot Point R2 | 105.73 |
| Daily Pivot Point R3 | 106.60 |
[/s2If]
Join Our Telegram Group
")


