The index starts the new year in an erratic fashion. (Pivot Orderbook analysis)
…
This is a premium post.
[s2If !current_user_can(access_s2member_level4)]Please register for PREMIUM VERSION HERE to read full post below containing analysis. In case of any error or you think you are not able to read the full post below, please email us at support#nehcap.com [lwa][/s2If] [s2If current_user_can(access_s2member_level4)]
- The index starts the new year in an erratic fashion.
- The multi-month low at 103.39 emerges as the next support.
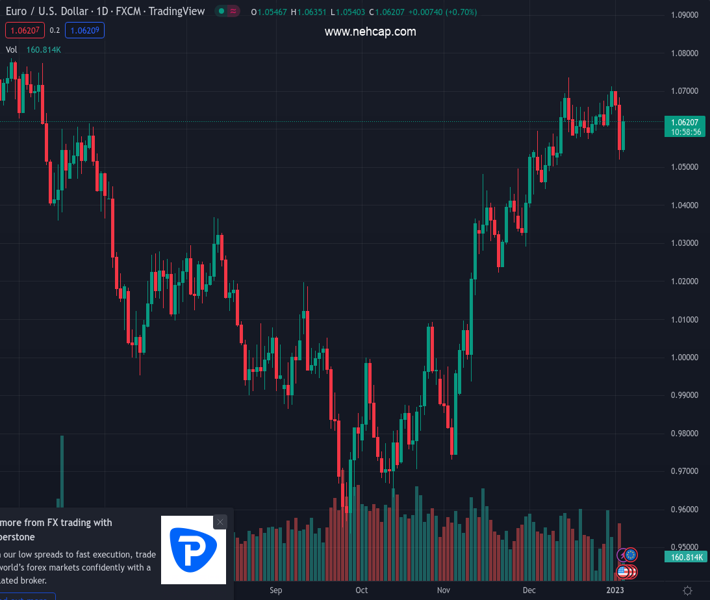
The pair currently trades last at 104.02.
The previous day high was 104.86 while the previous day low was 103.47. The daily 38.2% Fib levels comes at 104.33, expected to provide resistance. Similarly, the daily 61.8% fib level is at 104.0, expected to provide support.
DXY gives away most of Tuesday’s strong advance to the boundaries of the 105.00 hurdle and returns to the sub-104.00 region on Wednesday.
The index appears to have moved into a consolidative phase, although the outlook remains tilted to the downside while it remains below the key 200-day SMA at 106.25.
A deeper pullback could revisit the multi-month low at 103.39 (December 30). The loss of this region could leave the dollar vulnerable to further losses in the short-term horizon.
Technical Levels: Supports and Resistances
EURUSD currently trading at 104.02 at the time of writing. Pair opened at 104.68 and is trading with a change of -0.63 % .
| Overview | Overview.1 | |
|---|---|---|
| 0 | Today last price | 104.02 |
| 1 | Today Daily Change | 76.00 |
| 2 | Today Daily Change % | -0.63 |
| 3 | Today daily open | 104.68 |
The pair remains strongly bearish on the daily time frame. It trades below the 20 SMA @ 104.37, 50 SMA 105.53, 100 SMA @ 108.45 and 200 SMA @ 106.73.
| Trends | Trends.1 | |
|---|---|---|
| 0 | Daily SMA20 | 104.37 |
| 1 | Daily SMA50 | 105.53 |
| 2 | Daily SMA100 | 108.45 |
| 3 | Daily SMA200 | 106.73 |
The previous day high was 104.86 while the previous day low was 103.47. The daily 38.2% Fib levels comes at 104.33, expected to provide resistance. Similarly, the daily 61.8% fib level is at 104.0, expected to provide support.
Note the levels of interest below:
- Pivot support is noted at 103.81, 102.94, 102.42
- Pivot resistance is noted at 105.21, 105.73, 106.6
| Levels | Levels.1 |
|---|---|
| Previous Daily High | 104.86 |
| Previous Daily Low | 103.47 |
| Previous Weekly High | 104.56 |
| Previous Weekly Low | 103.39 |
| Previous Monthly High | 106.02 |
| Previous Monthly Low | 103.39 |
| Daily Fibonacci 38.2% | 104.33 |
| Daily Fibonacci 61.8% | 104.00 |
| Daily Pivot Point S1 | 103.81 |
| Daily Pivot Point S2 | 102.94 |
| Daily Pivot Point S3 | 102.42 |
| Daily Pivot Point R1 | 105.21 |
| Daily Pivot Point R2 | 105.73 |
| Daily Pivot Point R3 | 106.60 |
[/s2If]
Join Our Telegram Group
")


