#GBPUSD @ 1.20522 is awaiting the release of the Fed minutes for a decisive move. (Pivot Orderbook analysis)
…
This is a premium post.
[s2If !current_user_can(access_s2member_level4)]Please register for PREMIUM VERSION HERE to read full post below containing analysis. In case of any error or you think you are not able to read the full post below, please email us at support#nehcap.com [lwa][/s2If] [s2If current_user_can(access_s2member_level4)]
- GBP/USD is awaiting the release of the Fed minutes for a decisive move.
- Rising demand for US government bonds is weighing on the US Dollar Index.
- A consecutive shrink in US Manufacturing PMI is showing signs of a further slowdown in the price index.
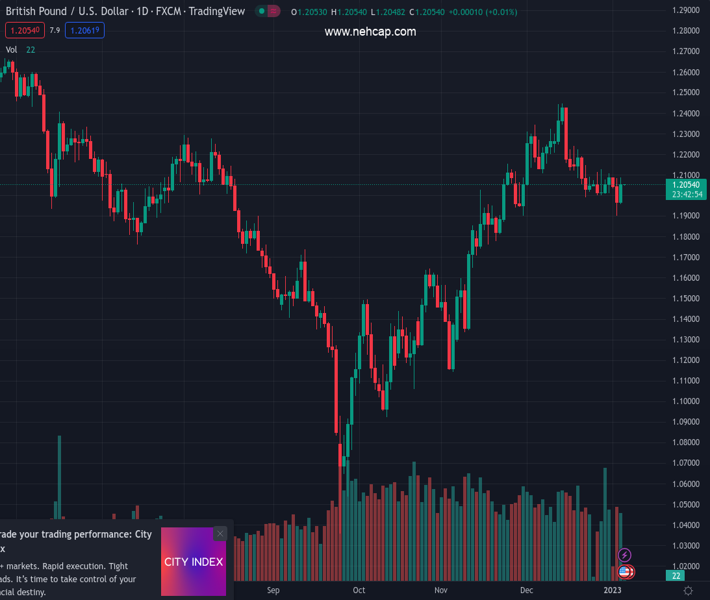
The pair currently trades last at 1.20522.
The previous day high was 1.2085 while the previous day low was 1.1901. The daily 38.2% Fib levels comes at 1.1971, expected to provide support. Similarly, the daily 61.8% fib level is at 1.2015, expected to provide support.
The GBP/USD pair has continued its sideways performance around 1.2050 as investors are awaiting the release of the Federal Open Market Committee (FOMC) minutes for fresh cues. The Cable asset displayed a wild gyration after the United States Institute of Supply Management (ISM) reported a shrink in the volume of manufacturing activities consecutively for the second time and then continued to auction sideways.
A decent recovery move in S&P500 on Wednesday after a two-day sell-off signifies that the risk appetite of the market participants has increased significantly. The US Dollar Index (DXY) dropped below the crucial support of 104.00 as the return on 10-year US Treasury bonds faced immense pressure. The 10-year US Treasury yields slipped to near 3.69% as a decline in Manufacturing PMI has been added to filters that call for a slowdown in the pace of policy tightening by the Federal Reserve (Fed).
On Wednesday, the US ISM Manufacturing PMI declined to 48.4 vs. the consensus of 48.5 and the former release of 49.0. A consecutive shrink in the extent of manufacturing activities is the outcome of higher interest rates by the Fed, which has forced firms to avoid debts due to higher interest obligations. Apart from that, New Order Index that indicates forward demand has dropped dramatically to 45.2. While the street was expecting a jump in the economic data to 48.1 from the prior release of 47.2.
For a decisive move, investors are awaiting the release of the Fed’s minutes for the December meeting, which will provide a detailed explanation of the policy outlook for CY2023. Fed chair Jerome Powell in a December policy meeting announced that interest rates will top above 5% and higher interest rates will be continued for a longer period to tame stubborn inflation.
On the United Kingdom front, A monthly survey conducted by Citi and YouGov revealed on Wednesday that the British public’s inflation expectations for 12 months ahead declined to 5.7% in December from 6.1% in the previous survey, as reported by Reuters. This is going to provide support to the Bank of England (BOE) which is worried about roaring inflation.
Technical Levels: Supports and Resistances
GBPUSD currently trading at 1.2057 at the time of writing. Pair opened at 1.1973 and is trading with a change of 0.7 % .
| Overview | Overview.1 | |
|---|---|---|
| 0 | Today last price | 1.2057 |
| 1 | Today Daily Change | 0.0084 |
| 2 | Today Daily Change % | 0.7000 |
| 3 | Today daily open | 1.1973 |
The pair is trading below its 20 Daily moving average @ 1.2143, above its 50 Daily moving average @ 1.1932 , above its 100 Daily moving average @ 1.1666 and above its 200 Daily moving average @ 1.2035
| Trends | Trends.1 | |
|---|---|---|
| 0 | Daily SMA20 | 1.2143 |
| 1 | Daily SMA50 | 1.1932 |
| 2 | Daily SMA100 | 1.1666 |
| 3 | Daily SMA200 | 1.2035 |
The previous day high was 1.2085 while the previous day low was 1.1901. The daily 38.2% Fib levels comes at 1.1971, expected to provide support. Similarly, the daily 61.8% fib level is at 1.2015, expected to provide support.
Note the levels of interest below:
- Pivot support is noted at 1.1887, 1.1802, 1.1703
- Pivot resistance is noted at 1.2072, 1.2171, 1.2257
| Levels | Levels.1 |
|---|---|
| Previous Daily High | 1.2085 |
| Previous Daily Low | 1.1901 |
| Previous Weekly High | 1.2126 |
| Previous Weekly Low | 1.2002 |
| Previous Monthly High | 1.2447 |
| Previous Monthly Low | 1.1992 |
| Daily Fibonacci 38.2% | 1.1971 |
| Daily Fibonacci 61.8% | 1.2015 |
| Daily Pivot Point S1 | 1.1887 |
| Daily Pivot Point S2 | 1.1802 |
| Daily Pivot Point S3 | 1.1703 |
| Daily Pivot Point R1 | 1.2072 |
| Daily Pivot Point R2 | 1.2171 |
| Daily Pivot Point R3 | 1.2257 |
[/s2If]
Join Our Telegram Group
")


