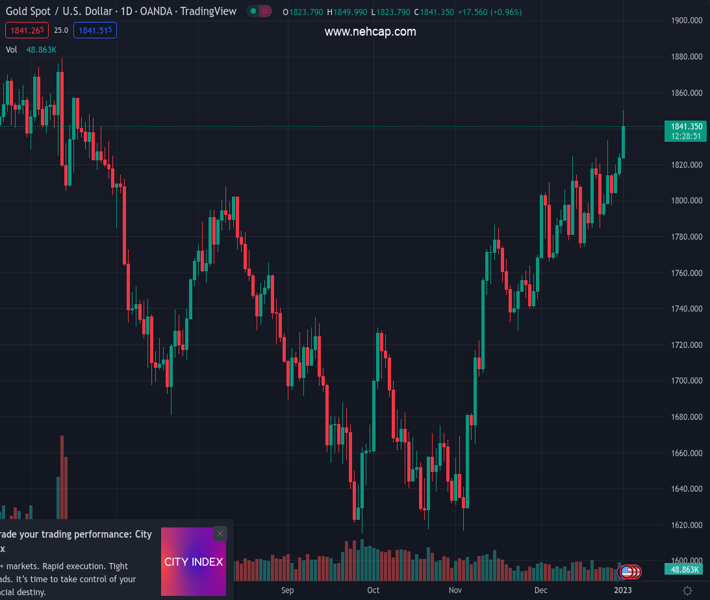
#XAUUSD @ 1,841.37 Gold price turns south after facing rejection at the $1,850 key level. (Pivot Orderbook analysis)
…
This is a premium post.
[s2If !current_user_can(access_s2member_level4)]Please register for PREMIUM VERSION HERE to read full post below containing analysis. In case of any error or you think you are not able to read the full post below, please email us at support#nehcap.com [lwa][/s2If] [s2If current_user_can(access_s2member_level4)]
- Gold price turns south after facing rejection at the $1,850 key level.
- The US Dollar rebound gathers steam in the European session.
- Sell-off in the US Treasury yields cap the downside in the Gold price.
The pair currently trades last at 1841.37.
The previous day high was 1823.76 while the previous day low was 1823.76. The daily 38.2% Fib levels comes at 1823.76, expected to provide support. Similarly, the daily 61.8% fib level is at 1823.76, expected to provide support.
Gold price is seeing a quick retracement from fresh seven-month highs of $1,850 reached in the early European morning. The ongoing retreat in the bright metal is owing to an impressive wave of US Dollar buying seen across the financial markets, as the first full trading day of 2023 kicks in.
The resurgent US Dollar demand is being witnessed despite a fresh risk rally in the European stock markets, with the pan-European Euro Stoxx 50 climbing 1.50% so far. The market mood remains underpinned by the expectations of a reopening in China from Covid-related restrictions while the country’s manufacturing sector showed a slight improvement in December.
Meanwhile, the pullback in the Gold price appears limited, as the weakness surrounding the US Treasury bond yields gathers steam and bodes well for the non-yielding precious metal.
Gold traders now await US S&P Global Manufacturing PMI for December and the Wall Street open for further trading cues.
Technical Levels: Supports and Resistances
XAUUSD currently trading at 1837.78 at the time of writing. Pair opened at 1823.76 and is trading with a change of 0.77 % .
| Overview | Overview.1 | |
|---|---|---|
| 0 | Today last price | 1837.78 |
| 1 | Today Daily Change | 14.03 |
| 2 | Today Daily Change % | 0.77 |
| 3 | Today daily open | 1823.76 |
The pair remains strongly bullish on the daily timeframe. It trades above its 20 SMA @ 1799.73, 50 SMA 1753.32, 100 SMA @ 1723.46 and 200 SMA @ 1779.69.
| Trends | Trends.1 | |
|---|---|---|
| 0 | Daily SMA20 | 1799.73 |
| 1 | Daily SMA50 | 1753.32 |
| 2 | Daily SMA100 | 1723.46 |
| 3 | Daily SMA200 | 1779.69 |
The previous day high was 1823.76 while the previous day low was 1823.76. The daily 38.2% Fib levels comes at 1823.76, expected to provide support. Similarly, the daily 61.8% fib level is at 1823.76, expected to provide support.
Note the levels of interest below:
- Pivot support is noted at 1823.76, 1823.76, 1823.76
- Pivot resistance is noted at 1823.76, 1823.76, 1823.76
| Levels | Levels.1 |
|---|---|
| Previous Daily High | 1823.76 |
| Previous Daily Low | 1823.76 |
| Previous Weekly High | 1833.38 |
| Previous Weekly Low | 1797.11 |
| Previous Monthly High | 1833.38 |
| Previous Monthly Low | 1765.89 |
| Daily Fibonacci 38.2% | 1823.76 |
| Daily Fibonacci 61.8% | 1823.76 |
| Daily Pivot Point S1 | 1823.76 |
| Daily Pivot Point S2 | 1823.76 |
| Daily Pivot Point S3 | 1823.76 |
| Daily Pivot Point R1 | 1823.76 |
| Daily Pivot Point R2 | 1823.76 |
| Daily Pivot Point R3 | 1823.76 |
[/s2If]
Join Our Telegram Group
")


