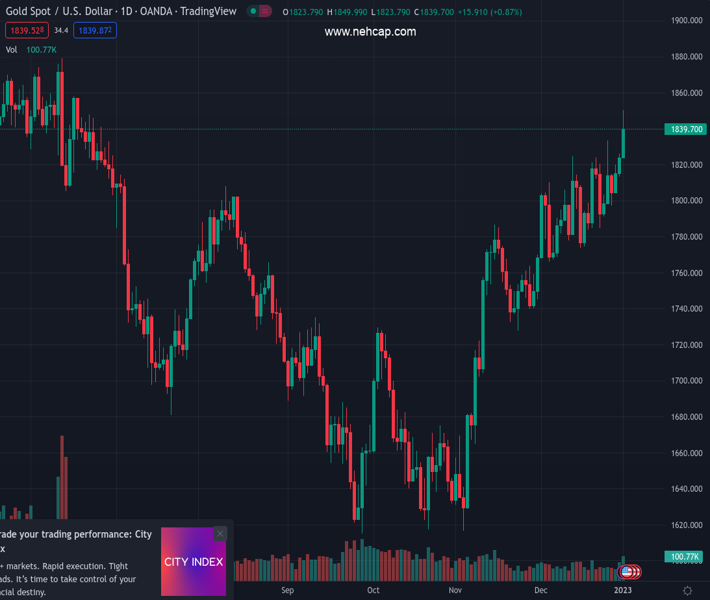
#XAUUSD @ 1,837.54 Gold price has dropped to test the breakout from the Ascending Triangle around $1,825.00. (Pivot Orderbook analysis)
…
This is a premium post.
[s2If !current_user_can(access_s2member_level4)]Please register for PREMIUM VERSION HERE to read full post below containing analysis. In case of any error or you think you are not able to read the full post below, please email us at support#nehcap.com [lwa][/s2If] [s2If current_user_can(access_s2member_level4)]
- Gold price has dropped to test the breakout from the Ascending Triangle around $1,825.00.
- Expectations of a higher interest rate peak by the Fed have triggered a risk-off market mood.
- The USD Index has climbed above 104.30 amid bumper consensus for December’s NFP data.
The pair currently trades last at 1837.54.
The previous day high was 1823.76 while the previous day low was 1823.76. The daily 38.2% Fib levels comes at 1823.76, expected to provide support. Similarly, the daily 61.8% fib level is at 1823.76, expected to provide support.
Gold price (XAU/USD) has shifted into a sideways auction profile after recovery from the crucial support around $1,828.00 in the late New York session. Earlier, the precious metal slipped sharply after failing to kiss the critical resistance of $1,850.00. The yellow metal is displaying a volatility contraction ahead of the release of the Federal Open Market Committee (FOMC) minutes.
Risk-perceived assets like S&P500 witnessed heat on Tuesday as investors are expecting a hawkish policy outlook from the FOMC minutes, which will release on Thursday. As the inflation rate is still stubborn and the labor market is extremely tight, the Federal Reserve could look for more interest rate hikes to compensate for a healthy Consumer Price Index (CPI). The 10-year US Treasury yields dropped to 3.75% despite a risk aversion theme in the global market.
The US Dollar Index (DXY) climbed above 104.30 after defending the downside bias below the major support of 103.00. The USD Index is gaining strength in anticipation of higher employment generation by the United States economy in the month of December. Analysts at TD Securities are anticipating a very solid net gain in December at 350k.
After a breakout of the Ascending Triangle chart pattern, Gold price has reversed to test the breakout region near the horizontal resistance of the chart pattern placed from December 13 high around $1,825.55. The 20-period Exponential Moving Average (EMA) around $1,825.00 is acting as major support for the Gold price.
The Relative Strength Index (RSI) (14) has shifted into the bullish range of 60.00-80.00 from the 40.00-60.00 range, which indicates more upside ahead.
Technical Levels: Supports and Resistances
XAUUSD currently trading at 1839.46 at the time of writing. Pair opened at 1823.76 and is trading with a change of 0.86 % .
| Overview | Overview.1 | |
|---|---|---|
| 0 | Today last price | 1839.46 |
| 1 | Today Daily Change | 15.70 |
| 2 | Today Daily Change % | 0.86 |
| 3 | Today daily open | 1823.76 |
The pair remains strongly bullish on the daily timeframe. It trades above its 20 SMA @ 1799.73, 50 SMA 1753.32, 100 SMA @ 1723.46 and 200 SMA @ 1779.69.
| Trends | Trends.1 | |
|---|---|---|
| 0 | Daily SMA20 | 1799.73 |
| 1 | Daily SMA50 | 1753.32 |
| 2 | Daily SMA100 | 1723.46 |
| 3 | Daily SMA200 | 1779.69 |
The previous day high was 1823.76 while the previous day low was 1823.76. The daily 38.2% Fib levels comes at 1823.76, expected to provide support. Similarly, the daily 61.8% fib level is at 1823.76, expected to provide support.
Note the levels of interest below:
- Pivot support is noted at 1823.76, 1823.76, 1823.76
- Pivot resistance is noted at 1823.76, 1823.76, 1823.76
| Levels | Levels.1 |
|---|---|
| Previous Daily High | 1823.76 |
| Previous Daily Low | 1823.76 |
| Previous Weekly High | 1833.38 |
| Previous Weekly Low | 1797.11 |
| Previous Monthly High | 1833.38 |
| Previous Monthly Low | 1765.89 |
| Daily Fibonacci 38.2% | 1823.76 |
| Daily Fibonacci 61.8% | 1823.76 |
| Daily Pivot Point S1 | 1823.76 |
| Daily Pivot Point S2 | 1823.76 |
| Daily Pivot Point S3 | 1823.76 |
| Daily Pivot Point R1 | 1823.76 |
| Daily Pivot Point R2 | 1823.76 |
| Daily Pivot Point R3 | 1823.76 |
[/s2If]
Join Our Telegram Group
")


