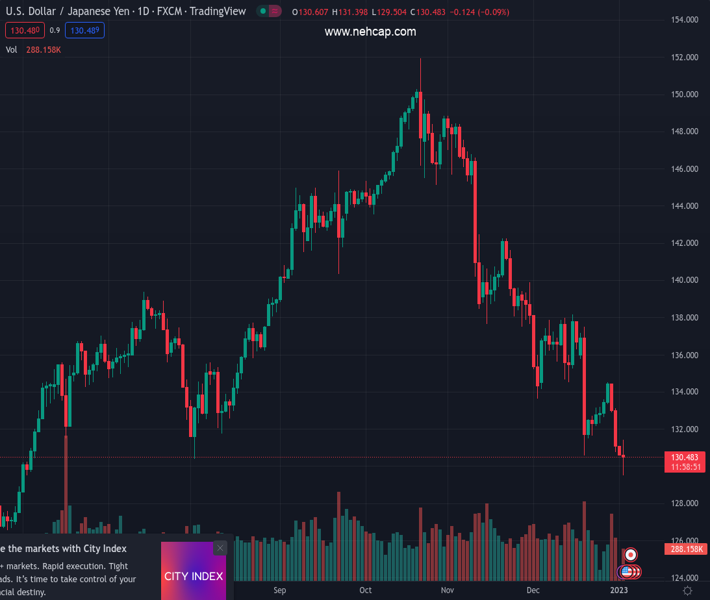
#USDJPY @ 130.470 staged a decisive recovery in the early European morning. (Pivot Orderbook analysis)
…
This is a premium post.
[s2If !current_user_can(access_s2member_level4)]Please register for PREMIUM VERSION HERE to read full post below containing analysis. In case of any error or you think you are not able to read the full post below, please email us at support#nehcap.com [lwa][/s2If] [s2If current_user_can(access_s2member_level4)]
- USD/JPY staged a decisive recovery in the early European morning.
- The pair returned into the negative territory after coming in within a touching distance of 131.00.
- Falling US Treasury bond yields make it difficult for the pair to gather momentum.
The pair currently trades last at 130.470.
The previous day high was 131.13 while the previous day low was 130.62. The daily 38.2% Fib levels comes at 130.82, expected to provide resistance. Similarly, the daily 61.8% fib level is at 130.94, expected to provide resistance.
USD/JPY reversed its direction and sharply rose toward 131.00 after having touched its lowest level since late May at 129.50 during the Asian trading hours. The pair, however, lost its bullish momentum and was last seen losing 0.25% on the day at 130.40.
The sudden US Dollar strength in the European morning provided a boost to the pair on Tuesday. Earlier in the day, the Japanese yen gathered strength on growing expectations of a hawkish Bank of Japan (BOJ) policy shift. Over the weekend, Nikkei reported that the BOJ was considering raising its inlation forecasts for 2023 and 2024 in January.
Meanwhile, the benchmark 10-year US Treasury bond yield is down more than 2% on a daily basis slightly below 3.75%, making it difficult for the pair to preserve its bullish momentum.
Nevertheless, the US Dollar Index is still up 1% on the day despite the positive shift witnessed in risk sentiment.
With trading conditions normalizing following the New Year holiday, the market action remains irregular early Tuesday. US stock index futures are up more than 1%.
Technical Levels: Supports and Resistances
USDJPY currently trading at 130.4 at the time of writing. Pair opened at 130.72 and is trading with a change of -0.24 % .
| Overview | Overview.1 | |
|---|---|---|
| 0 | Today last price | 130.40 |
| 1 | Today Daily Change | -0.32 |
| 2 | Today Daily Change % | -0.24 |
| 3 | Today daily open | 130.72 |
The pair remains strongly bearish on the daily time frame. It trades below the 20 SMA @ 134.6, 50 SMA 139.2, 100 SMA @ 141.08 and 200 SMA @ 136.26.
| Trends | Trends.1 | |
|---|---|---|
| 0 | Daily SMA20 | 134.60 |
| 1 | Daily SMA50 | 139.20 |
| 2 | Daily SMA100 | 141.08 |
| 3 | Daily SMA200 | 136.26 |
The previous day high was 131.13 while the previous day low was 130.62. The daily 38.2% Fib levels comes at 130.82, expected to provide resistance. Similarly, the daily 61.8% fib level is at 130.94, expected to provide resistance.
Note the levels of interest below:
- Pivot support is noted at 130.52, 130.31, 130.0
- Pivot resistance is noted at 131.03, 131.34, 131.55
| Levels | Levels.1 |
|---|---|
| Previous Daily High | 131.13 |
| Previous Daily Low | 130.62 |
| Previous Weekly High | 134.50 |
| Previous Weekly Low | 130.78 |
| Previous Monthly High | 138.18 |
| Previous Monthly Low | 130.57 |
| Daily Fibonacci 38.2% | 130.82 |
| Daily Fibonacci 61.8% | 130.94 |
| Daily Pivot Point S1 | 130.52 |
| Daily Pivot Point S2 | 130.31 |
| Daily Pivot Point S3 | 130.00 |
| Daily Pivot Point R1 | 131.03 |
| Daily Pivot Point R2 | 131.34 |
| Daily Pivot Point R3 | 131.55 |
[/s2If]
Join Our Telegram Group
")


