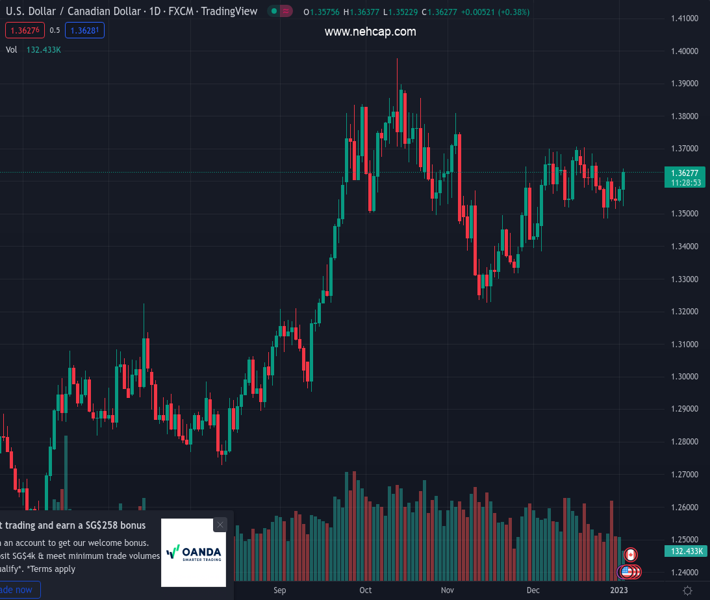
#USDCAD @ 1.36301 gained traction in the early European session on Tuesday. (Pivot Orderbook analysis)
…
This is a premium post.
[s2If !current_user_can(access_s2member_level4)]Please register for PREMIUM VERSION HERE to read full post below containing analysis. In case of any error or you think you are not able to read the full post below, please email us at support#nehcap.com [lwa][/s2If] [s2If current_user_can(access_s2member_level4)]
- USD/CAD gained traction in the early European session on Tuesday.
- US Dollar Index posts strong daily gains near 104.50.
- WTI continues to fluctuate in tight range slightly above $80.
The pair currently trades last at 1.36301.
The previous day high was 1.3584 while the previous day low was 1.3525. The daily 38.2% Fib levels comes at 1.3561, expected to provide support. Similarly, the daily 61.8% fib level is at 1.3548, expected to provide support.
USD/CAD gathered bullish momentum and advanced beyond 1.3600 in the European session on Tuesday following a drop toward 1.3500 earlier in the day. At the time od press, USD/CAD was up 0.4% on the day at 1.3625.
The broad-based US Dollar strength seems to be fueling the pair’s rebound ahead of the Manufacturing PMI data from Canada and the US.
With market participants returning from the New Year holiday early Tuesday, the market volatility heightened and the US Dollar started to outperform its rivals despite the improving market mood.
The US Dollar Index, which tracks the US Dollar’s performance against its major rivals, was last seen rising 1.1% on the day at 104.60. It’s difficult to pinpoint the catalyst behind the renewed US Dollar strength as the 10-year US Treasury bond yield is down more than 2% and US stock index futures are up more than 1%.
In the second half of the day, S&P Global will release the December Manufacturing PMI surveys for Canada and the US. Since the US PMI data will be a revision, the market reaction to Canada PMI is likely to drive the action.
Meanwhile, the barrel of West Texas Intermediate fluctuates in a tight channel at around $80.00, allowing the US Dollar’s valuation to steer the pair’s movements. Traders are trying to figure out how the reopening steps taken by China will influence the energy demand outlook.
Technical Levels: Supports and Resistances
USDCAD currently trading at 1.362 at the time of writing. Pair opened at 1.3572 and is trading with a change of 0.35 % .
| Overview | Overview.1 | |
|---|---|---|
| 0 | Today last price | 1.3620 |
| 1 | Today Daily Change | 0.0048 |
| 2 | Today Daily Change % | 0.3500 |
| 3 | Today daily open | 1.3572 |
The pair remains strongly bullish on the daily timeframe. It trades above its 20 SMA @ 1.3606, 50 SMA 1.3525, 100 SMA @ 1.3451 and 200 SMA @ 1.3127.
| Trends | Trends.1 | |
|---|---|---|
| 0 | Daily SMA20 | 1.3606 |
| 1 | Daily SMA50 | 1.3525 |
| 2 | Daily SMA100 | 1.3451 |
| 3 | Daily SMA200 | 1.3127 |
The previous day high was 1.3584 while the previous day low was 1.3525. The daily 38.2% Fib levels comes at 1.3561, expected to provide support. Similarly, the daily 61.8% fib level is at 1.3548, expected to provide support.
Note the levels of interest below:
- Pivot support is noted at 1.3537, 1.3502, 1.3478
- Pivot resistance is noted at 1.3596, 1.3619, 1.3654
| Levels | Levels.1 |
|---|---|
| Previous Daily High | 1.3584 |
| Previous Daily Low | 1.3525 |
| Previous Weekly High | 1.3612 |
| Previous Weekly Low | 1.3484 |
| Previous Monthly High | 1.3705 |
| Previous Monthly Low | 1.3385 |
| Daily Fibonacci 38.2% | 1.3561 |
| Daily Fibonacci 61.8% | 1.3548 |
| Daily Pivot Point S1 | 1.3537 |
| Daily Pivot Point S2 | 1.3502 |
| Daily Pivot Point S3 | 1.3478 |
| Daily Pivot Point R1 | 1.3596 |
| Daily Pivot Point R2 | 1.3619 |
| Daily Pivot Point R3 | 1.3654 |
[/s2If]
Join Our Telegram Group
")


