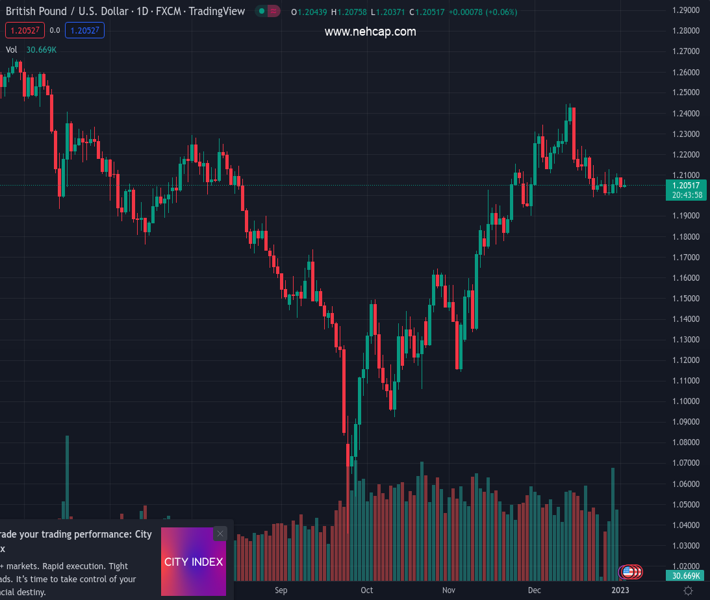
#GBPUSD @ 1.20512 is oscillating in a 1.2000-1.2126 range for the past 10 trading sessions. (Pivot Orderbook analysis)
…
This is a premium post.
[s2If !current_user_can(access_s2member_level4)]Please register for PREMIUM VERSION HERE to read full post below containing analysis. In case of any error or you think you are not able to read the full post below, please email us at support#nehcap.com [lwa][/s2If] [s2If current_user_can(access_s2member_level4)]
- GBP/USD is oscillating in a 1.2000-1.2126 range for the past 10 trading sessions.
- The 200-EMA around 1.2027 is acting as a major cushion for the Cable.
- A 40.00-60.00 range oscillation by the RSI (14) indicates an absence of a potential trigger.
The pair currently trades last at 1.20512.
The previous day high was 1.2102 while the previous day low was 1.2034. The daily 38.2% Fib levels comes at 1.206, expected to provide resistance. Similarly, the daily 61.8% fib level is at 1.2076, expected to provide resistance.
The GBP/USD pair has delivered an upside break of the consolidation formed in a narrow range of 1.2040-1.2046 in the Asian session. The Cable asset has climbed above 1.2060 but is still likely to remain inside the woods as the market mood is still quiet.
It is difficult to ascertain the risk profile at the current juncture as the trading activity is still low. Meanwhile, S&P500 futures have initiated the week on a bearish note, portraying caution ahead of the release of the Federal Open Market Committee (FOMC) minutes this week.
On a four-hour scale, the Cable asset is tightly holding the cushion from the 200-period Exponential Moving Average (EMA) around 1.2027. As the 200-EMA has turned flat, a rangebound performance is likely to persist ahead till the absence of a potential trigger. For the past 10 trading sessions, the Cable is oscillating in a range of 1.2000-1.2126.
The Relative Strength Index (RSI) (14) is continuously oscillating in a 40.00-60.00 range, which indicates volatility contraction, which will be followed by a breakout in the same.
Should the Cable break above December 26 high at 1.2126, Pound Sterling bulls will drive the major towards the round-level resistance at 1.2200. A breach of the latter will drive the pair towards December 12 high around 1.2300.
Alternatively, a break below the psychological support of 1.2000 will drag the Cable towards November 18 high around 1.1950 followed by November 30 low at 1.1900.
Technical Levels: Supports and Resistances
GBPUSD currently trading at 1.2054 at the time of writing. Pair opened at 1.2049 and is trading with a change of 0.04 % .
| Overview | Overview.1 | |
|---|---|---|
| 0 | Today last price | 1.2054 |
| 1 | Today Daily Change | 0.0005 |
| 2 | Today Daily Change % | 0.0400 |
| 3 | Today daily open | 1.2049 |
The pair is trading below its 20 Daily moving average @ 1.2151, above its 50 Daily moving average @ 1.1922 , above its 100 Daily moving average @ 1.1667 and above its 200 Daily moving average @ 1.2041
| Trends | Trends.1 | |
|---|---|---|
| 0 | Daily SMA20 | 1.2151 |
| 1 | Daily SMA50 | 1.1922 |
| 2 | Daily SMA100 | 1.1667 |
| 3 | Daily SMA200 | 1.2041 |
The previous day high was 1.2102 while the previous day low was 1.2034. The daily 38.2% Fib levels comes at 1.206, expected to provide resistance. Similarly, the daily 61.8% fib level is at 1.2076, expected to provide resistance.
Note the levels of interest below:
- Pivot support is noted at 1.2021, 1.1994, 1.1954
- Pivot resistance is noted at 1.2089, 1.2129, 1.2156
| Levels | Levels.1 |
|---|---|
| Previous Daily High | 1.2102 |
| Previous Daily Low | 1.2034 |
| Previous Weekly High | 1.2126 |
| Previous Weekly Low | 1.2002 |
| Previous Monthly High | 1.2447 |
| Previous Monthly Low | 1.1992 |
| Daily Fibonacci 38.2% | 1.2060 |
| Daily Fibonacci 61.8% | 1.2076 |
| Daily Pivot Point S1 | 1.2021 |
| Daily Pivot Point S2 | 1.1994 |
| Daily Pivot Point S3 | 1.1954 |
| Daily Pivot Point R1 | 1.2089 |
| Daily Pivot Point R2 | 1.2129 |
| Daily Pivot Point R3 | 1.2156 |
[/s2If]
Join Our Telegram Group
")


