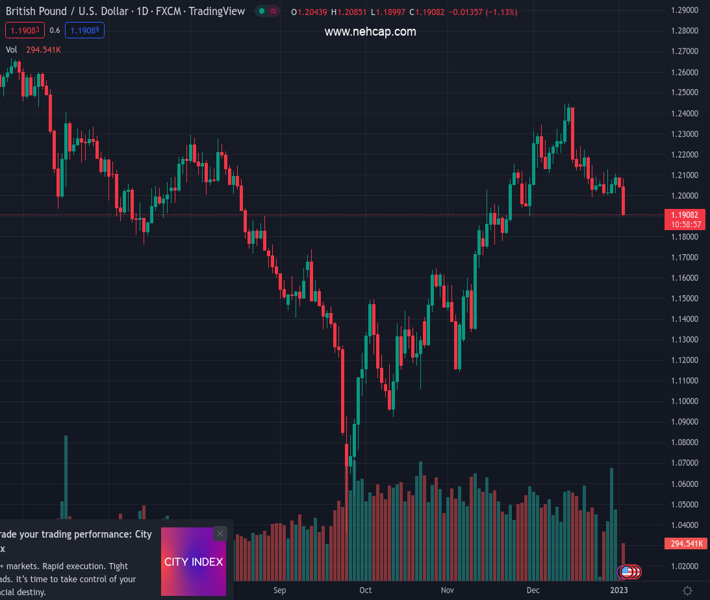
#GBPUSD @ 1.19070 came under heavy bearish pressure on Tuesday. (Pivot Orderbook analysis)
…
This is a premium post.
[s2If !current_user_can(access_s2member_level4)]Please register for PREMIUM VERSION HERE to read full post below containing analysis. In case of any error or you think you are not able to read the full post below, please email us at support#nehcap.com [lwa][/s2If] [s2If current_user_can(access_s2member_level4)]
- GBP/USD came under heavy bearish pressure on Tuesday.
- US Dollar outperforms its rivals as investors return from holidays.
- Investors keep an eye on political developments in the UK.
The pair currently trades last at 1.19070.
The previous day high was 1.2102 while the previous day low was 1.2034. The daily 38.2% Fib levels comes at 1.206, expected to provide resistance. Similarly, the daily 61.8% fib level is at 1.2076, expected to provide resistance.
After having spent the Asian session in a very tight range slightly below 1.2100, GBP/USD fell sharply in the European morning and touched its lowest level in a month near 1.1900. The pair was last seen losing 1.1% on the day at 1.1915.
Despite a lack of fundamental drivers, the US Dollar started the day on a firm footing with investors returning from the New Year holiday. The US Dollar Index, which lost nearly 1% in the last two trading days of 2022, rose decisively and advanced above 140.70, where it was up 1.2% on a daily basis.
Meanwhile, political jitters in the UK seem to be putting additional weight on the Pound Sterling. The Telegraph reported over the weekend that British Prime Minister Rishi Sunak had shelved the childcare reform that was designed to help parents save money and return to work. Additionally, the first of five consecutive days of national rail strikes have gone underway on Tuesday.
Later in the day, November Construction Spending and S&P Global’s December (final) Manufacturing PMI from the US will ve looked upon for fresh impetus. Ahead of these data releases, Wall Street’s main indexes remain on track to open in positive territory with US stock index futures rising arounf 1% during the European trading hours. Nevertheless, the risk positive market environment is yet to detail the US Dollar’s rally.
Technical Levels: Supports and Resistances
GBPUSD currently trading at 1.1916 at the time of writing. Pair opened at 1.2049 and is trading with a change of -1.1 % .
| Overview | Overview.1 | |
|---|---|---|
| 0 | Today last price | 1.1916 |
| 1 | Today Daily Change | -0.0133 |
| 2 | Today Daily Change % | -1.1000 |
| 3 | Today daily open | 1.2049 |
The pair is trading below its 20 Daily moving average @ 1.2151, below its 50 Daily moving average @ 1.1922 , above its 100 Daily moving average @ 1.1667 and below its 200 Daily moving average @ 1.2041
| Trends | Trends.1 | |
|---|---|---|
| 0 | Daily SMA20 | 1.2151 |
| 1 | Daily SMA50 | 1.1922 |
| 2 | Daily SMA100 | 1.1667 |
| 3 | Daily SMA200 | 1.2041 |
The previous day high was 1.2102 while the previous day low was 1.2034. The daily 38.2% Fib levels comes at 1.206, expected to provide resistance. Similarly, the daily 61.8% fib level is at 1.2076, expected to provide resistance.
Note the levels of interest below:
- Pivot support is noted at 1.2021, 1.1994, 1.1954
- Pivot resistance is noted at 1.2089, 1.2129, 1.2156
| Levels | Levels.1 |
|---|---|
| Previous Daily High | 1.2102 |
| Previous Daily Low | 1.2034 |
| Previous Weekly High | 1.2126 |
| Previous Weekly Low | 1.2002 |
| Previous Monthly High | 1.2447 |
| Previous Monthly Low | 1.1992 |
| Daily Fibonacci 38.2% | 1.2060 |
| Daily Fibonacci 61.8% | 1.2076 |
| Daily Pivot Point S1 | 1.2021 |
| Daily Pivot Point S2 | 1.1994 |
| Daily Pivot Point S3 | 1.1954 |
| Daily Pivot Point R1 | 1.2089 |
| Daily Pivot Point R2 | 1.2129 |
| Daily Pivot Point R3 | 1.2156 |
[/s2If]
Join Our Telegram Group
")


