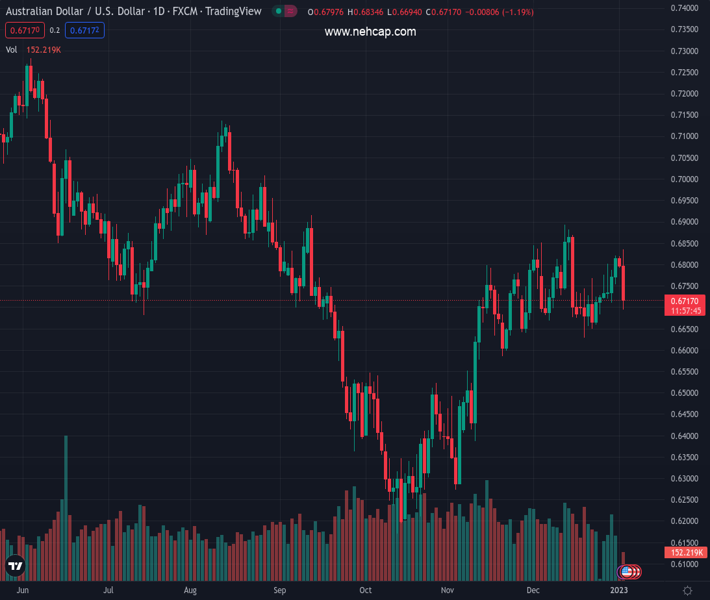
#AUDUSD @ 0.67199 is attempting a dead cat bounce above 0.6700. (Pivot Orderbook analysis)
…
This is a premium post.
[s2If !current_user_can(access_s2member_level4)]Please register for PREMIUM VERSION HERE to read full post below containing analysis. In case of any error or you think you are not able to read the full post below, please email us at support#nehcap.com [lwa][/s2If] [s2If current_user_can(access_s2member_level4)]
- AUD/USD is attempting a dead cat bounce above 0.6700.
- The US Dollar demand remains unabated despite the risk rally.
- The Aussie pair awaits the US Manufacturing data for some respite.
The pair currently trades last at 0.67199.
The previous day high was 0.6825 while the previous day low was 0.6793. The daily 38.2% Fib levels comes at 0.6805, expected to provide resistance. Similarly, the daily 61.8% fib level is at 0.6813, expected to provide resistance.
AUD/USD is seeing a tepid bounce from one-week lows of 0.6695 but bulls remain cautious above the 0.6700 barrier. The US Dollar is holding the upper hand across the FX board so far this Tuesday, as investors look for solace in the greenback on the first trading day of the year.
China’s covid concerns, high inflation and risks of an imminent recession worldwide have continued to sap investors’ confidence. Markets could be creating fresh US Dollar positions to fend off those risks while gearing up for a fresh economic release from the US later this Tuesday. The US S&P Global Manufacturing PMI will be published in the American session alongside a few minority reports.
Meanwhile, the Aussie fails to capitalize on the risk flows and upbear Chinese Caixin Manufacturing PMI data, as the US Dollar strength remains the main market driver, thus far. China’s Caixin Manufacturing PMI for December dropped to 49.0 vs. 48.8 expected and 49.4 previous.
Technical Levels: Supports and Resistances
AUDUSD currently trading at 0.6715 at the time of writing. Pair opened at 0.6805 and is trading with a change of -1.28 % .
| Overview | Overview.1 | |
|---|---|---|
| 0 | Today last price | 0.6715 |
| 1 | Today Daily Change | -0.0087 |
| 2 | Today Daily Change % | -1.2800 |
| 3 | Today daily open | 0.6805 |
The pair is trading below its 20 Daily moving average @ 0.6744, above its 50 Daily moving average @ 0.6655 , above its 100 Daily moving average @ 0.664 and below its 200 Daily moving average @ 0.686
| Trends | Trends.1 | |
|---|---|---|
| 0 | Daily SMA20 | 0.6744 |
| 1 | Daily SMA50 | 0.6655 |
| 2 | Daily SMA100 | 0.6640 |
| 3 | Daily SMA200 | 0.6860 |
The previous day high was 0.6825 while the previous day low was 0.6793. The daily 38.2% Fib levels comes at 0.6805, expected to provide resistance. Similarly, the daily 61.8% fib level is at 0.6813, expected to provide resistance.
Note the levels of interest below:
- Pivot support is noted at 0.679, 0.6776, 0.6759
- Pivot resistance is noted at 0.6822, 0.6839, 0.6853
| Levels | Levels.1 |
|---|---|
| Previous Daily High | 0.6825 |
| Previous Daily Low | 0.6793 |
| Previous Weekly High | 0.6821 |
| Previous Weekly Low | 0.6710 |
| Previous Monthly High | 0.6893 |
| Previous Monthly Low | 0.6629 |
| Daily Fibonacci 38.2% | 0.6805 |
| Daily Fibonacci 61.8% | 0.6813 |
| Daily Pivot Point S1 | 0.6790 |
| Daily Pivot Point S2 | 0.6776 |
| Daily Pivot Point S3 | 0.6759 |
| Daily Pivot Point R1 | 0.6822 |
| Daily Pivot Point R2 | 0.6839 |
| Daily Pivot Point R3 | 0.6853 |
[/s2If]
Join Our Telegram Group
")


