#AUDJPY @ 88.1760 Dampened sentiment kept the trading in negative territory. (Pivot Orderbook analysis)
…
This is a premium post.
[s2If !current_user_can(access_s2member_level4)]Please register for PREMIUM VERSION HERE to read full post below containing analysis. In case of any error or you think you are not able to read the full post below, please email us at support#nehcap.com [lwa][/s2If] [s2If current_user_can(access_s2member_level4)]
- Dampened sentiment kept the AUD/JPY trading in negative territory.
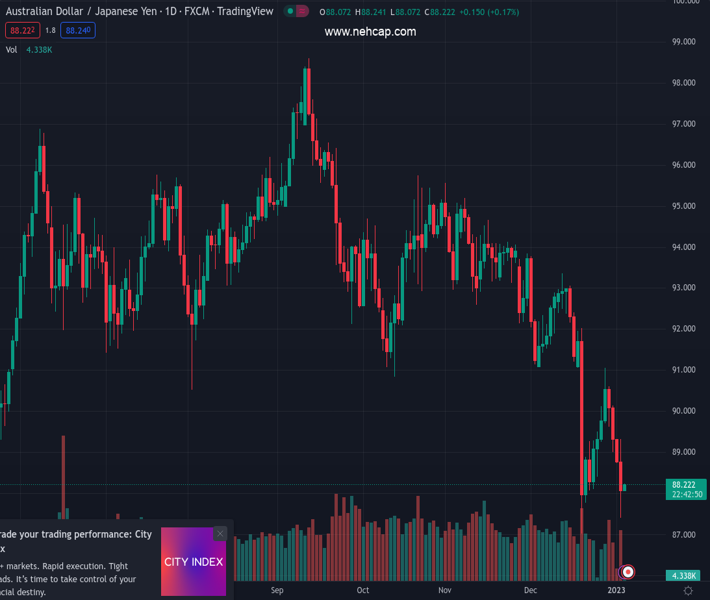
- AUD/JPY Price Analysis: Double bottom could be forming in the daily chart, targeting the 100-DMA around 92.41.
The pair currently trades last at 88.1760.
The previous day high was 89.36 while the previous day low was 88.86. The daily 38.2% Fib levels comes at 89.05, expected to provide resistance. Similarly, the daily 61.8% fib level is at 89.17, expected to provide resistance.
On Tuesday, the AUD/JPY reached a fresh two-week low around 87.41, though it finished the session around 88.07, extending its losses to four consecutive days after testing the 20-day Exponential Moving Average (EMA) around 90.92 on December 28. As Wednesday’s Asian session begins, the AUD/JPY is trading at 88.12.
The AUD/JPY daily chart suggests the cross-currency as neutral-to-downward biased, though it should be said that a double bottom surfaced at around the 87.00 mark. The Relative Strength Index (RSI) remains in bearish territory but its slope shifted flat, while the Rate of Change (RoC) shows that selling pressure is waning.
If the AUD/JPY climbs above the 20-day EMA at 90.07 and clears the December 28 daily high at 91.05, the double bottom would be confirmed. Therefore, the AUD/JPY’s next resistance would be the confluence of the 50 and 200-day EMA around 91.60, followed by the 92.00 figure, ahead of the 100-day EMA at 92.41.
As an alternate scenario, the AUD/JPY first support would be the 88.00 mark. Break below will expose December’s low around 87.01, followed by March’s 15 swing low of 84.59.
Technical Levels: Supports and Resistances
AUDJPY currently trading at 88.15 at the time of writing. Pair opened at 88.95 and is trading with a change of -0.9 % .
| Overview | Overview.1 | |
|---|---|---|
| 0 | Today last price | 88.15 |
| 1 | Today Daily Change | -0.80 |
| 2 | Today Daily Change % | -0.90 |
| 3 | Today daily open | 88.95 |
The pair remains strongly bearish on the daily time frame. It trades below the 20 SMA @ 90.77, 50 SMA 92.57, 100 SMA @ 93.59 and 200 SMA @ 93.28.
| Trends | Trends.1 | |
|---|---|---|
| 0 | Daily SMA20 | 90.77 |
| 1 | Daily SMA50 | 92.57 |
| 2 | Daily SMA100 | 93.59 |
| 3 | Daily SMA200 | 93.28 |
The previous day high was 89.36 while the previous day low was 88.86. The daily 38.2% Fib levels comes at 89.05, expected to provide resistance. Similarly, the daily 61.8% fib level is at 89.17, expected to provide resistance.
Note the levels of interest below:
- Pivot support is noted at 88.75, 88.56, 88.26
- Pivot resistance is noted at 89.25, 89.55, 89.75
| Levels | Levels.1 |
|---|---|
| Previous Daily High | 89.36 |
| Previous Daily Low | 88.86 |
| Previous Weekly High | 91.06 |
| Previous Weekly Low | 89.02 |
| Previous Monthly High | 93.81 |
| Previous Monthly Low | 87.02 |
| Daily Fibonacci 38.2% | 89.05 |
| Daily Fibonacci 61.8% | 89.17 |
| Daily Pivot Point S1 | 88.75 |
| Daily Pivot Point S2 | 88.56 |
| Daily Pivot Point S3 | 88.26 |
| Daily Pivot Point R1 | 89.25 |
| Daily Pivot Point R2 | 89.55 |
| Daily Pivot Point R3 | 89.75 |
[/s2If]
Join Our Telegram Group
")


