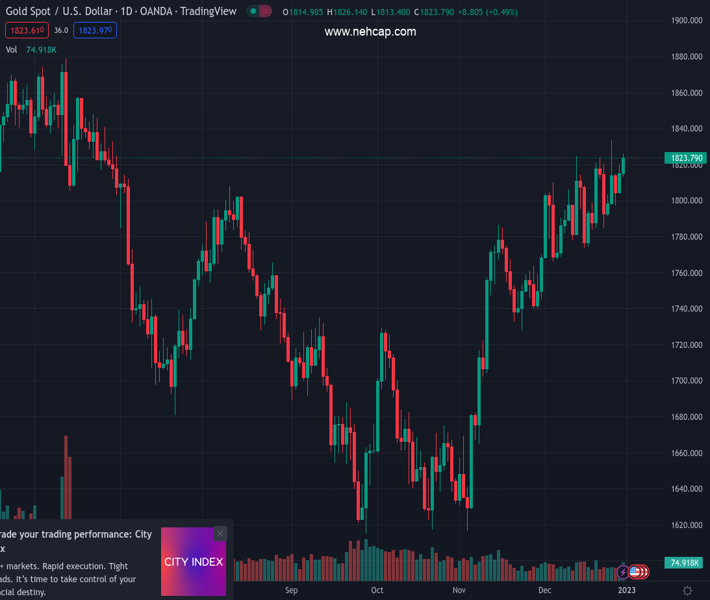
#XAUUSD @ 1,825.56 Gold price is looking to recapture the crucial resistance of $1,830.00 ahead. (Pivot Orderbook analysis)
…
This is a premium post.
[s2If !current_user_can(access_s2member_level4)]Please register for PREMIUM VERSION HERE to read full post below containing analysis. In case of any error or you think you are not able to read the full post below, please email us at support#nehcap.com [lwa][/s2If] [s2If current_user_can(access_s2member_level4)]
- Gold price is looking to recapture the crucial resistance of $1,830.00 ahead.
- Fed’s higher interest rate peak might put the US Dollar Index back in action.
- Gold price is auctioning in an Ascending Triangle that indicates a volatility contraction.
The pair currently trades last at 1825.56.
The previous day high was 1826.12 while the previous day low was 1813.51. The daily 38.2% Fib levels comes at 1821.3, expected to provide support. Similarly, the daily 61.8% fib level is at 1818.33, expected to provide support.
Gold price (XAU/USD) settled around $1,823.00 on Friday after failing to surpass the same resistance despite a sell-off in the US Dollar Index (DXY). The precious metal delivered a gradual upside move from the psychological support of $1,800.00 after sheer pain in the USD Index.
The USD Index delivered a breakdown of the two-week consolidation formed in a narrow range of 103.47-104.57 as investors shrugged off uncertainty over China’s Covid-19 situation. A sheer pace in the reopening phase of the Chinese economy has spiked the number of infections, which has triggered short-term pain in economic prospects. However, the economic projections have started attracting optimism from the think tanks in the market.
Meanwhile, the Gold price could face immense pressure if rumors of higher interest rate peak by the Federal Reserve (Fed) get more air. A note from TD Securities claims that “Note that the Committee signaled expectations of a substantially higher terminal rate for 2023 despite implementing a downshift in the pace of rate increases to 50 basis points (bps) at the December meeting. We are of the view that the terminal rate will reach a range of 5.25-5.50% by the May Federal Open Market Committee (FOMC) meeting.”
Gold price is auctioning in an Ascending Triangle chart pattern on a four-hour scale. The horizontal resistance of the aforementioned chart pattern is placed from December 13 high at $1,824.55 while the upward-sloping trendline is plotted from December 16 low at $1,774.36.
Advancing 20-and 50-period Exponential Moving Averages (EMAs) at $1,814.77 and $1,807.43 respectively add to the upside filters.
Meanwhile, the Relative Strength Index (RSI) (14) has shifted into the bullish range of 60.00-80.00 from the 40.00-60.00 range, which indicates more upside ahead.
Technical Levels: Supports and Resistances
XAUUSD currently trading at 1823.76 at the time of writing. Pair opened at 1823.56 and is trading with a change of 0.01 % .
| Overview | Overview.1 | |
|---|---|---|
| 0 | Today last price | 1823.76 |
| 1 | Today Daily Change | 0.20 |
| 2 | Today Daily Change % | 0.01 |
| 3 | Today daily open | 1823.56 |
The pair remains strongly bullish on the daily timeframe. It trades above its 20 SMA @ 1796.88, 50 SMA 1749.84, 100 SMA @ 1723.02 and 200 SMA @ 1780.36.
| Trends | Trends.1 | |
|---|---|---|
| 0 | Daily SMA20 | 1796.88 |
| 1 | Daily SMA50 | 1749.84 |
| 2 | Daily SMA100 | 1723.02 |
| 3 | Daily SMA200 | 1780.36 |
The previous day high was 1826.12 while the previous day low was 1813.51. The daily 38.2% Fib levels comes at 1821.3, expected to provide support. Similarly, the daily 61.8% fib level is at 1818.33, expected to provide support.
Note the levels of interest below:
- Pivot support is noted at 1816.01, 1808.45, 1803.4
- Pivot resistance is noted at 1828.62, 1833.67, 1841.23
| Levels | Levels.1 |
|---|---|
| Previous Daily High | 1826.12 |
| Previous Daily Low | 1813.51 |
| Previous Weekly High | 1833.38 |
| Previous Weekly Low | 1797.11 |
| Previous Monthly High | 1833.38 |
| Previous Monthly Low | 1765.89 |
| Daily Fibonacci 38.2% | 1821.30 |
| Daily Fibonacci 61.8% | 1818.33 |
| Daily Pivot Point S1 | 1816.01 |
| Daily Pivot Point S2 | 1808.45 |
| Daily Pivot Point S3 | 1803.40 |
| Daily Pivot Point R1 | 1828.62 |
| Daily Pivot Point R2 | 1833.67 |
| Daily Pivot Point R3 | 1841.23 |
[/s2If]
Join Our Telegram Group
")


