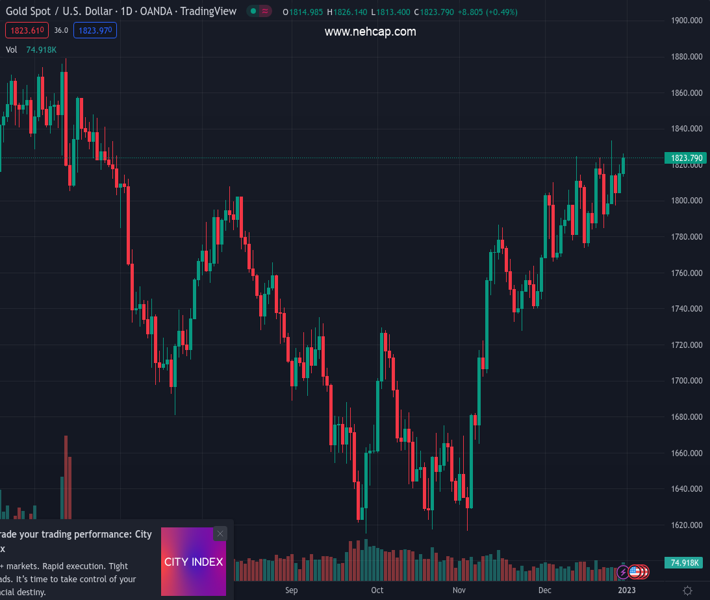
#XAUUSD @ 1,823.69 Gold price treads water as holidays in the key markets restrict moves., @nehcap view: Limited upside expected (Pivot Orderbook analysis)
…
This is a premium post.
[s2If !current_user_can(access_s2member_level4)]Please register for PREMIUM VERSION HERE to read full post below containing analysis. In case of any error or you think you are not able to read the full post below, please email us at support#nehcap.com [lwa][/s2If] [s2If current_user_can(access_s2member_level4)]
- Gold price treads water as holidays in the key markets restrict XAU/USD moves.
- Challenges to sentiment from China, IMF comments could probe Gold buyers.
- Cautious mood ahead of Fed Minutes, US NFP may also challenge XAU/USD upside.
- US Dollar Index rebounds from seven-month low despite recently downbeat US data.
The pair currently trades last at 1823.69.
The previous day high was 1826.12 while the previous day low was 1813.51. The daily 38.2% Fib levels comes at 1821.3, expected to provide support. Similarly, the daily 61.8% fib level is at 1818.33, expected to provide support.
Gold price (XAU/USD) seesaw near $1,825 during early Monday, mostly unchanged, as holidays in multiple markets restrict the metal’s immediate moves despite the US Dollar’s rebound.
The quote’s latest inaction could also be linked to the mixed US data and recent challenges to the market sentiment, as well as the cautious mood ahead of this week’s top-tier data/events.
It’s should be noted that most of the recent US data, including the figures concerning inflation and activities, have been downbeat and tame the woes surrounding the price pressure in the world’s biggest economy. The same previously propelled the Fed to bolster the rates and trigger recession woes. Hence, softer data weigh on the hawkish Fed bets and question the US Dollar buyers.
Elsewhere, doubts over China’s economic recovery, due to the Covid outbreak, join the downbeat comments from the International Monetary Fund’s (IMF) Managing Director Kristalina Georgieva concerning Beijing also challenging the Gold price.
It’s worth noting, however, IMF’s Georgieva appears optimistic about the US growth conditions and hence puts a floor under the US Dollar’s latest moves.
Looking forward, Wednesday’s Minutes of the latest Federal Open Market Committee (FOMC) meeting, as well as Friday’s December month employment numbers for the US, will be crucial for Gold traders to watch.
Also read: Gold Price Annual Forecast: Will 2023 be the year Gold shines?
Gold price seesaws inside a three-day-old rising wedge bearish chart formation as bulls keep the reins around a six-month high.
That said, sluggish MACD and RSI conditions join the bearish chart pattern to challenge the XAU/USD buyers. As a result, Gold sellers could aim for further downside on breaking the $1,817 support, comprising the lower line of the stated wedge.
Even so, the 200-HMA and an ascending support line from mid-December, respectively around $1,807 and $1,798, could probe the downside momentum before giving control to the Gold bears.
Alternatively, an upside clearance of the $1,828 hurdle comprising the wedge’s top line, will defy the bearish chart formation.
It should be noted that the previous monthly high surrounding $1,835 acts as the last defense of the Gold bears ahead of directing the prices toward the June 2022 swing high near $1,880.
Trend: Limited upside expected
Technical Levels: Supports and Resistances
XAUUSD currently trading at 1823.76 at the time of writing. Pair opened at 1823.56 and is trading with a change of 0.01% % .
| Overview | Overview.1 | |
|---|---|---|
| 0 | Today last price | 1823.76 |
| 1 | Today Daily Change | 0.20 |
| 2 | Today Daily Change % | 0.01% |
| 3 | Today daily open | 1823.56 |
The pair remains strongly bullish on the daily timeframe. It trades above its 20 SMA @ 1796.88, 50 SMA 1749.84, 100 SMA @ 1723.02 and 200 SMA @ 1780.36.
| Trends | Trends.1 | |
|---|---|---|
| 0 | Daily SMA20 | 1796.88 |
| 1 | Daily SMA50 | 1749.84 |
| 2 | Daily SMA100 | 1723.02 |
| 3 | Daily SMA200 | 1780.36 |
The previous day high was 1826.12 while the previous day low was 1813.51. The daily 38.2% Fib levels comes at 1821.3, expected to provide support. Similarly, the daily 61.8% fib level is at 1818.33, expected to provide support.
Note the levels of interest below:
- Pivot support is noted at 1816.01, 1808.45, 1803.4
- Pivot resistance is noted at 1828.62, 1833.67, 1841.23
| Levels | Levels.1 |
|---|---|
| Previous Daily High | 1826.12 |
| Previous Daily Low | 1813.51 |
| Previous Weekly High | 1833.38 |
| Previous Weekly Low | 1797.11 |
| Previous Monthly High | 1833.38 |
| Previous Monthly Low | 1765.89 |
| Daily Fibonacci 38.2% | 1821.30 |
| Daily Fibonacci 61.8% | 1818.33 |
| Daily Pivot Point S1 | 1816.01 |
| Daily Pivot Point S2 | 1808.45 |
| Daily Pivot Point S3 | 1803.40 |
| Daily Pivot Point R1 | 1828.62 |
| Daily Pivot Point R2 | 1833.67 |
| Daily Pivot Point R3 | 1841.23 |
[/s2If]
Join Our Telegram Group
")


