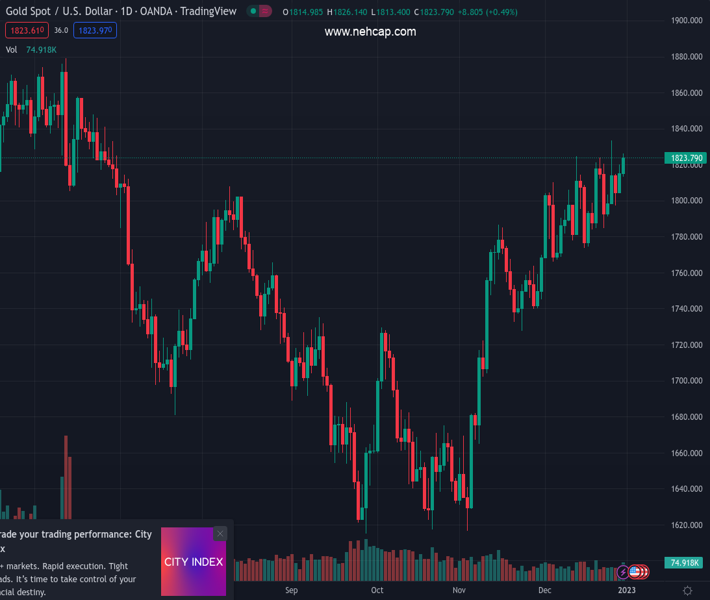
#XAUUSD @ 1,823.69 Gold price is facing pressure in surpassing the immediate hurdle of $1,823.00. (Pivot Orderbook analysis)
…
This is a premium post.
[s2If !current_user_can(access_s2member_level4)]Please register for PREMIUM VERSION HERE to read full post below containing analysis. In case of any error or you think you are not able to read the full post below, please email us at support#nehcap.com [lwa][/s2If] [s2If current_user_can(access_s2member_level4)]
- Gold price is facing pressure in surpassing the immediate hurdle of $1,823.00.
- Less trading activity is expected ahead amid the festive mood in the global market.
- Going forward, investors will keep an eye on US ISM Manufacturing PMI data.
The pair currently trades last at 1823.69.
The previous day high was 1826.12 while the previous day low was 1813.51. The daily 38.2% Fib levels comes at 1821.3, expected to provide support. Similarly, the daily 61.8% fib level is at 1818.33, expected to provide support.
Gold price (XAU/USD) is struggling to extend its upside journey above the immediate resistance of $1,823.00. The precious metal is expected to remain lackluster amid the festive mood for New Year celebrations, therefore, trading activity will remain quiet in various nations.
The US Dollar Index (DXY) settled the last trading session on a weak note after delivering a south-side break of the consolidation formed in a 103.47-104.57 range. The USD Index dropped to near the round-level support of 103.00. Meanwhile, S&P500 witnessed some sell-off on Friday as investors turned cautious for the CY2023 outlook, portraying ambiguity in the risk impulse.
Going forward, investors will focus on the United States ISM Manufacturing PMI data (Dec), which will release on Wednesday. As per the consensus, the ISM Manufacturing data will escalate to 49.6 vs. the former release of 49.0. Apart from that, investors will keep New Orders Index on the radar, which might climb to 48.1 against the prior release of 47.2. A decent improvement in demand anticipants may also support the US Dollar Index.
Gold price is auctioning in an Ascending Triangle chart pattern on a four-hour scale. The horizontal resistance of the aforementioned chart pattern is placed from December 13 high at $1,824.55 while the upward-sloping trendline is plotted from December 16 low at $1,774.36.
Advancing 20-and 50-period Exponential Moving Averages (EMAs) at $1,814.77 and $1,807.43 respectively add to the upside filters.
Meanwhile, the Relative Strength Index (RSI) (14) has shifted into the bullish range of 60.00-80.00 from the 40.00-60.00 range, which indicates more upside ahead.
Technical Levels: Supports and Resistances
XAUUSD currently trading at 1823.76 at the time of writing. Pair opened at 1823.56 and is trading with a change of 0.01 % .
| Overview | Overview.1 | |
|---|---|---|
| 0 | Today last price | 1823.76 |
| 1 | Today Daily Change | 0.20 |
| 2 | Today Daily Change % | 0.01 |
| 3 | Today daily open | 1823.56 |
The pair remains strongly bullish on the daily timeframe. It trades above its 20 SMA @ 1796.88, 50 SMA 1749.84, 100 SMA @ 1723.02 and 200 SMA @ 1780.36.
| Trends | Trends.1 | |
|---|---|---|
| 0 | Daily SMA20 | 1796.88 |
| 1 | Daily SMA50 | 1749.84 |
| 2 | Daily SMA100 | 1723.02 |
| 3 | Daily SMA200 | 1780.36 |
The previous day high was 1826.12 while the previous day low was 1813.51. The daily 38.2% Fib levels comes at 1821.3, expected to provide support. Similarly, the daily 61.8% fib level is at 1818.33, expected to provide support.
Note the levels of interest below:
- Pivot support is noted at 1816.01, 1808.45, 1803.4
- Pivot resistance is noted at 1828.62, 1833.67, 1841.23
| Levels | Levels.1 |
|---|---|
| Previous Daily High | 1826.12 |
| Previous Daily Low | 1813.51 |
| Previous Weekly High | 1833.38 |
| Previous Weekly Low | 1797.11 |
| Previous Monthly High | 1833.38 |
| Previous Monthly Low | 1765.89 |
| Daily Fibonacci 38.2% | 1821.30 |
| Daily Fibonacci 61.8% | 1818.33 |
| Daily Pivot Point S1 | 1816.01 |
| Daily Pivot Point S2 | 1808.45 |
| Daily Pivot Point S3 | 1803.40 |
| Daily Pivot Point R1 | 1828.62 |
| Daily Pivot Point R2 | 1833.67 |
| Daily Pivot Point R3 | 1841.23 |
[/s2If]
Join Our Telegram Group
")


