#USDJPY @ 130.660 Japanese Yen remains strong across the board. (Pivot Orderbook analysis)
…
This is a premium post.
[s2If !current_user_can(access_s2member_level4)]Please register for PREMIUM VERSION HERE to read full post below containing analysis. In case of any error or you think you are not able to read the full post below, please email us at support#nehcap.com [lwa][/s2If] [s2If current_user_can(access_s2member_level4)]
- Japanese Yen remains strong across the board.
- US Dollar posts mixt results on a low volume session.
- USD/JPY prints fresh daily lows at 130.61.
The pair currently trades last at 130.660.
The previous day high was 133.1 while the previous day low was 130.78. The daily 38.2% Fib levels comes at 131.66, expected to provide resistance. Similarly, the daily 61.8% fib level is at 132.21, expected to provide resistance.
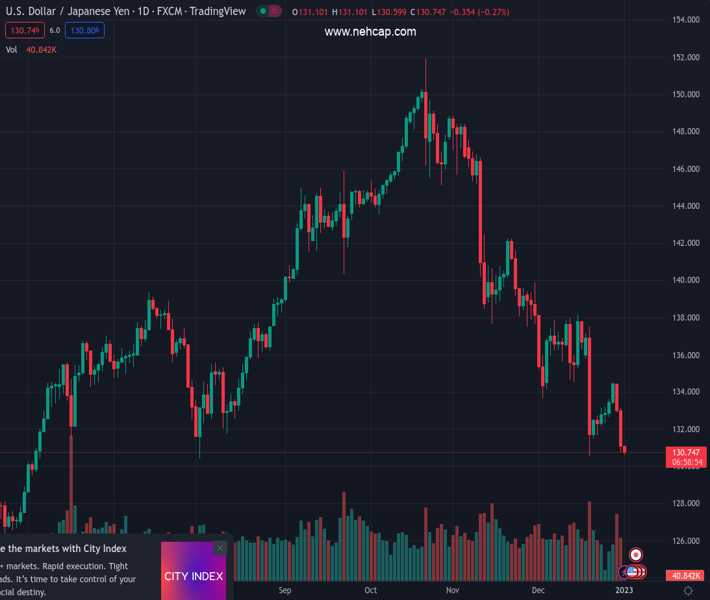
The USD/JPY is testing the December lows near 130.60, falling for the third day in a row on a quiet session with US markets closed. Price action remains limited across the FX board and the Yen is among the top performers.
The pair is falling for the third consecutive day and is approaching the December intraday low at 130.56. A slide below would put the USD/JPY at the lowest level since August 2. Last Friday, it posted the lowest daily close since early June.
The bias remains bearish for USD/JPY. A slide under 130.50 would expose the next support at 130.35 and then the 130.00. Earlier on Monday, the pair tested levels above 131.00 but it was rejected and pulled back. A consolidation above could trigger a deeper bullish correction. Only a break above 135.20 would change the current bearish short-term outlook to neutral/bullish.
Wall Street is closed on Monday. On Tuesday, market activity will return to normal. The economic calendar shows key events ahead in the US with the FOMC minutes on Wednesday and the official US employment report on Friday. The employment numbers and the FOMC minutes will likely weigh on market expectations regarding monetary policy.
The USD/JPY lost more than 5% in December after losing 8.50% in November. The decline was helped by the change in the Bank of Japan’s Yield Curve Control allowing a bigger price range in the 10-year JGB. Market participants saw that as a sign of a potential shift in BoJ’s ultra-dovish monetary policy, reducing the divergence with the Fed.
Technical Levels: Supports and Resistances
USDJPY currently trading at 130.68 at the time of writing. Pair opened at 131.27 and is trading with a change of -0.45 % .
| Overview | Overview.1 | |
|---|---|---|
| 0 | Today last price | 130.68 |
| 1 | Today Daily Change | -0.59 |
| 2 | Today Daily Change % | -0.45 |
| 3 | Today daily open | 131.27 |
The pair remains strongly bearish on the daily time frame. It trades below the 20 SMA @ 134.91, 50 SMA 139.56, 100 SMA @ 141.1 and 200 SMA @ 136.23.
| Trends | Trends.1 | |
|---|---|---|
| 0 | Daily SMA20 | 134.91 |
| 1 | Daily SMA50 | 139.56 |
| 2 | Daily SMA100 | 141.10 |
| 3 | Daily SMA200 | 136.23 |
The previous day high was 133.1 while the previous day low was 130.78. The daily 38.2% Fib levels comes at 131.66, expected to provide resistance. Similarly, the daily 61.8% fib level is at 132.21, expected to provide resistance.
Note the levels of interest below:
- Pivot support is noted at 130.34, 129.4, 128.02
- Pivot resistance is noted at 132.65, 134.03, 134.97
| Levels | Levels.1 |
|---|---|
| Previous Daily High | 133.10 |
| Previous Daily Low | 130.78 |
| Previous Weekly High | 134.50 |
| Previous Weekly Low | 130.78 |
| Previous Monthly High | 138.18 |
| Previous Monthly Low | 130.57 |
| Daily Fibonacci 38.2% | 131.66 |
| Daily Fibonacci 61.8% | 132.21 |
| Daily Pivot Point S1 | 130.34 |
| Daily Pivot Point S2 | 129.40 |
| Daily Pivot Point S3 | 128.02 |
| Daily Pivot Point R1 | 132.65 |
| Daily Pivot Point R2 | 134.03 |
| Daily Pivot Point R3 | 134.97 |
[/s2If]
Join Our Telegram Group
")


