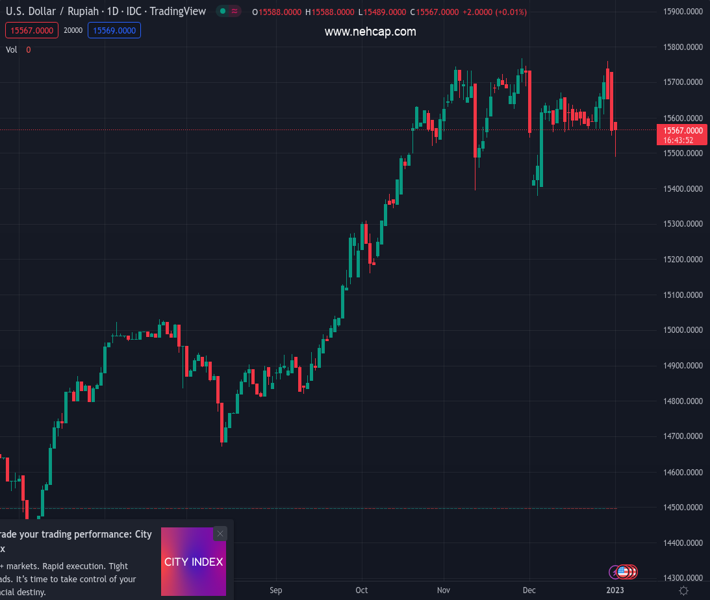
#USDIDR @ 15,565.0 picks up bids to snap two-day downtrend as US Dollar rebounds during holiday-thinned markets. (Pivot Orderbook analysis)
…
This is a premium post.
[s2If !current_user_can(access_s2member_level4)]Please register for PREMIUM VERSION HERE to read full post below containing analysis. In case of any error or you think you are not able to read the full post below, please email us at support#nehcap.com [lwa][/s2If] [s2If current_user_can(access_s2member_level4)]
- USD/IDR picks up bids to snap two-day downtrend as US Dollar rebounds during holiday-thinned markets.
- Indonesia Inflation, S&P Global PMI came in firmer for December, President Widodo expects 2023 growth above 5.0%.
- Markets remain inactive but doubts surrounding China seem to weigh on IDR.
- US PMIs, FOMC Meeting Minutes and the US employment report will be crucial to watch for clear directions.
The pair currently trades last at 15565.0.
The previous day high was 15731.0 while the previous day low was 15412.9. The daily 38.2% Fib levels comes at 15534.4142, expected to provide support. Similarly, the daily 61.8% fib level is at 15609.4858, expected to provide resistance.
USD/IDR prints to mild gains around $15,560, following a two-day downtrend, as US Dollar rebounds amid a sluggish trading day. In doing so, the Indonesia Rupiah (IDR) pair ignores downbeat Indonesia data.
That said, Indonesia’s Inflation rose by 5.51% YoY versus 5.39% previous whereas the MoM figures grew by 0.66% compared to 0.09% prior release. It’s worth noting that Core Inflation grew by 3.36% YoY against 3.3% previous readings. Furthermore, Indonesia S&P Global PMI for December also improved to 50.9 versus 50.3.
Earlier in the day, Indonesia President Joko Widodo mentioned, per Reuters, that he expects 2023 growth above 5.0%.
It should be observed that the latest Indonesia Inflation figures are above the Bank Indonesia (BI) target range between 2.0% and 4.0%, which in turn should have propelled the IDR. However, economic fears surrounding China, as well as holidays in major markets seemed to have allowed the USD/IDR bears to take a breather.
Doubts over China’s economic recovery, due to the Covid outbreak, join the downbeat comments from the International Monetary Fund’s (IMF) Managing Director Kristalina Georgieva concerning Beijing, seem to underpin the US Dollar rebound. Even so, the latest headlines from Reuters seem to challenge the IDR bears by pushing back pessimism surrounding China. “Some people in China’s key cities of Beijing, Shanghai and Wuhan braved the cold and a spike in COVID-19 infections to return to regular activity on Monday, confident of a boost to the economy as more recover from infections,” said Reuters.
Given the light calendar and off in multiple markets, not to forget recently mixed signals surrounding China, USD/IDR is likely to remain firmer. However, this week’s activity data from the US, Minutes of the latest Federal Open Market Committee (FOMC) meeting and December month employment numbers are crucial for clear directions.
A successful trading beyond a five-month-old ascending support line, currently around $15,455, keeps USD/IDR buyers hopeful of challenging November 2022 peak of $15,821.
Technical Levels: Supports and Resistances
USDIDR currently trading at 15558.05 at the time of writing. Pair opened at 15525.6 and is trading with a change of 0.21% % .
| Overview | Overview.1 | |
|---|---|---|
| 0 | Today last price | 15558.05 |
| 1 | Today Daily Change | 32.4500 |
| 2 | Today Daily Change % | 0.21% |
| 3 | Today daily open | 15525.6 |
The pair is trading below its 20 Daily moving average @ 15604.88, below its 50 Daily moving average @ 15612.014 , above its 100 Daily moving average @ 15341.8865 and above its 200 Daily moving average @ 15004.6687
| Trends | Trends.1 | |
|---|---|---|
| 0 | Daily SMA20 | 15604.8800 |
| 1 | Daily SMA50 | 15612.0140 |
| 2 | Daily SMA100 | 15341.8865 |
| 3 | Daily SMA200 | 15004.6687 |
The previous day high was 15731.0 while the previous day low was 15412.9. The daily 38.2% Fib levels comes at 15534.4142, expected to provide support. Similarly, the daily 61.8% fib level is at 15609.4858, expected to provide resistance.
Note the levels of interest below:
- Pivot support is noted at 15382.0, 15238.4, 15063.9
- Pivot resistance is noted at 15700.1, 15874.6, 16018.2
| Levels | Levels.1 |
|---|---|
| Previous Daily High | 15731.0000 |
| Previous Daily Low | 15412.9000 |
| Previous Weekly High | 15797.3500 |
| Previous Weekly Low | 15412.9000 |
| Previous Monthly High | 15797.3500 |
| Previous Monthly Low | 15289.4500 |
| Daily Fibonacci 38.2% | 15534.4142 |
| Daily Fibonacci 61.8% | 15609.4858 |
| Daily Pivot Point S1 | 15382.0000 |
| Daily Pivot Point S2 | 15238.4000 |
| Daily Pivot Point S3 | 15063.9000 |
| Daily Pivot Point R1 | 15700.1000 |
| Daily Pivot Point R2 | 15874.6000 |
| Daily Pivot Point R3 | 16018.2000 |
[/s2If]
Join Our Telegram Group
")


