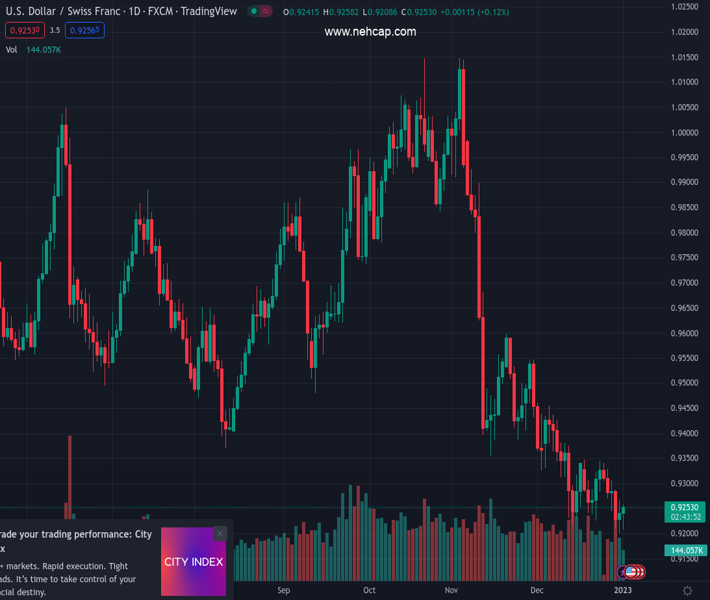
#USDCHF @ 0.92540 The downfall stalled around 0.9200 as a triple bottom emerged. (Pivot Orderbook analysis)
…
This is a premium post.
[s2If !current_user_can(access_s2member_level4)]Please register for PREMIUM VERSION HERE to read full post below containing analysis. In case of any error or you think you are not able to read the full post below, please email us at support#nehcap.com [lwa][/s2If] [s2If current_user_can(access_s2member_level4)]
- The USD/CHF downfall stalled around 0.9200 as a triple bottom emerged.
- A falling wedge and oscillator flashing selling pressure waning could pave the way for further upside in the USD/CHF.
- USD/CHF is poised for a break above 0.9300 as it eyes a test of the 20-day EMA.
The pair currently trades last at 0.92540.
The previous day high was 0.9268 while the previous day low was 0.9201. The daily 38.2% Fib levels comes at 0.9243, expected to provide support. Similarly, the daily 61.8% fib level is at 0.9227, expected to provide support.
The Swiss Franc (CHF) bounces at around 0.9200 and climbs toward 0.9250s amidst the North American session, which witnessed light liquidity conditions in the observance of 2023 new year’s eve. Therefore, the lack of US and Swiss economic data left traders adrift to market mood and technical. At the time of writing, the USD/CHF is trading at 0.9255, above its opening price by 0.15%.
The daily chart displays the pair as downward biased, but it also appears to have bottomed at around 0.9200. Since December, the USD/CHF pair’s inability to break below 0.9200, forming a triple bottom, opened the door for a leg-up, though low liquidity conditions since the last week keep the USD/CHF pair unable to test the 0.9300 figure. The Relative Strength Index (RSI) remains in bearish territory, capping any rallies toward 0.9300, while the Rate of Change (RoC) displays that selling pressure is waning.
Also, the USD/CHF is forming a falling wedge that it’s bullish. Therefore, the USD/CHF might test the 0/9300 figure, closely followed by a challenge of the 20-day Exponential Moving Average (EMA) at around 0.9319. The break above will expose the top-trendline of a descending channel around 0.9370, followed by the 0.9400 figure.
Technical Levels: Supports and Resistances
USDCHF currently trading at 0.9257 at the time of writing. Pair opened at 0.9246 and is trading with a change of 0.12 % .
| Overview | Overview.1 | |
|---|---|---|
| 0 | Today last price | 0.9257 |
| 1 | Today Daily Change | 0.0011 |
| 2 | Today Daily Change % | 0.1200 |
| 3 | Today daily open | 0.9246 |
The pair remains strongly bearish on the daily time frame. It trades below the 20 SMA @ 0.9318, 50 SMA 0.9537, 100 SMA @ 0.9655 and 200 SMA @ 0.9644.
| Trends | Trends.1 | |
|---|---|---|
| 0 | Daily SMA20 | 0.9318 |
| 1 | Daily SMA50 | 0.9537 |
| 2 | Daily SMA100 | 0.9655 |
| 3 | Daily SMA200 | 0.9644 |
The previous day high was 0.9268 while the previous day low was 0.9201. The daily 38.2% Fib levels comes at 0.9243, expected to provide support. Similarly, the daily 61.8% fib level is at 0.9227, expected to provide support.
Note the levels of interest below:
- Pivot support is noted at 0.9208, 0.9171, 0.9141
- Pivot resistance is noted at 0.9276, 0.9306, 0.9343
| Levels | Levels.1 |
|---|---|
| Previous Daily High | 0.9268 |
| Previous Daily Low | 0.9201 |
| Previous Weekly High | 0.9338 |
| Previous Weekly Low | 0.9201 |
| Previous Monthly High | 0.9471 |
| Previous Monthly Low | 0.9201 |
| Daily Fibonacci 38.2% | 0.9243 |
| Daily Fibonacci 61.8% | 0.9227 |
| Daily Pivot Point S1 | 0.9208 |
| Daily Pivot Point S2 | 0.9171 |
| Daily Pivot Point S3 | 0.9141 |
| Daily Pivot Point R1 | 0.9276 |
| Daily Pivot Point R2 | 0.9306 |
| Daily Pivot Point R3 | 0.9343 |
[/s2If]
Join Our Telegram Group
")


