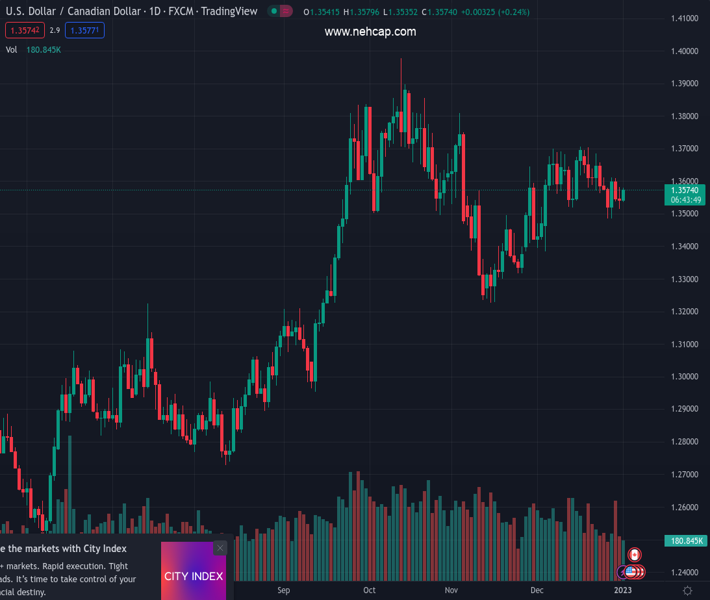
#USDCAD @ 1.35750 The US Dollar regains some composture and climbs against the Canadian Dollar. (Pivot Orderbook analysis)
…
This is a premium post.
[s2If !current_user_can(access_s2member_level4)]Please register for PREMIUM VERSION HERE to read full post below containing analysis. In case of any error or you think you are not able to read the full post below, please email us at support#nehcap.com [lwa][/s2If] [s2If current_user_can(access_s2member_level4)]
- The US Dollar regains some composture and climbs against the Canadian Dollar.
- Canadian and US S&P Global Manufacturing PMIs for December would update the current state of factory activity.
- USD/CAD Price Analysis: Range-bound, unable to break above/below the 1.35/1.36 range.
The pair currently trades last at 1.35750.
The previous day high was 1.3582 while the previous day low was 1.3514. The daily 38.2% Fib levels comes at 1.354, expected to provide support. Similarly, the daily 61.8% fib level is at 1.3556, expected to provide support.
The USD/CAD bounces off nearby the 50-day Exponential Moving Average (EMA) at 1.3532 and rises toward the 20-day EMA, during the first trading day of 2023 in the North American session, amidst thin liquidity conditions, as most markets remain closed on the observance of new year’s eve. At the time of typing, the USD/CAD is trading at 1.3573 after hitting a low of 1.3535.
European equities are trading on a higher note in low-volume conditions. The US Dollar Index, a gauge of the buck’s value against a basket of six currencies, advances 0.14% to 103.63, off six-month lows hit during the last week at 103.38. the lack of US and Canadian economic data keeps traders leaning on market mood and technicals.
Ahead of the week, Tuesday’s economic docket will feature the S&P Global Manufacturing PMIs for both countries, with Canada’s PMI expected to drop to 49.2, below the previous month’s reading of 49.6. Concerning the US, the PMI is estimated to stay unchanged compared to November’s 46.2 reading. Meanwhile, the ISM Manufacturing PMI reading for Wednesday is expected to further contract below the 49.0 mark, increasing the odds of a recession in the United States. Additional to the ISM report, the US docket will release December’s Federal Reserve (Fed) last meeting minutes, which would shed some light regardings the 2023 monetary policy overview.
From a daily chart perspective, the USD/CAD remains within familiar technical levels, unable to crack the bottom/top of the 1.3500/1.3600 range, capped by the 20 and 50-day EMAs. Oscillators like the Relative Strength Index (RSI) and the Rate of Change (RoC) exited from the bearish territory, opening the door for further USD/CAD upside. However, until the USD/CAD pair decisively breaks above 1.3600, that could open the door toward 1.3700. On the flip side, if the USD/CAD tumbles below 1.3500, that could pave the way for fresh four-week lows below 1.3484.
Technical Levels: Supports and Resistances
USDCAD currently trading at 1.3575 at the time of writing. Pair opened at 1.354 and is trading with a change of 0.26 % .
| Overview | Overview.1 | |
|---|---|---|
| 0 | Today last price | 1.3575 |
| 1 | Today Daily Change | 0.0035 |
| 2 | Today Daily Change % | 0.2600 |
| 3 | Today daily open | 1.3540 |
The pair is trading below its 20 Daily moving average @ 1.3607, above its 50 Daily moving average @ 1.3527 , above its 100 Daily moving average @ 1.3444 and above its 200 Daily moving average @ 1.3122
| Trends | Trends.1 | |
|---|---|---|
| 0 | Daily SMA20 | 1.3607 |
| 1 | Daily SMA50 | 1.3527 |
| 2 | Daily SMA100 | 1.3444 |
| 3 | Daily SMA200 | 1.3122 |
The previous day high was 1.3582 while the previous day low was 1.3514. The daily 38.2% Fib levels comes at 1.354, expected to provide support. Similarly, the daily 61.8% fib level is at 1.3556, expected to provide support.
Note the levels of interest below:
- Pivot support is noted at 1.3508, 1.3477, 1.344
- Pivot resistance is noted at 1.3576, 1.3613, 1.3644
| Levels | Levels.1 |
|---|---|
| Previous Daily High | 1.3582 |
| Previous Daily Low | 1.3514 |
| Previous Weekly High | 1.3612 |
| Previous Weekly Low | 1.3484 |
| Previous Monthly High | 1.3705 |
| Previous Monthly Low | 1.3385 |
| Daily Fibonacci 38.2% | 1.3540 |
| Daily Fibonacci 61.8% | 1.3556 |
| Daily Pivot Point S1 | 1.3508 |
| Daily Pivot Point S2 | 1.3477 |
| Daily Pivot Point S3 | 1.3440 |
| Daily Pivot Point R1 | 1.3576 |
| Daily Pivot Point R2 | 1.3613 |
| Daily Pivot Point R3 | 1.3644 |
[/s2If]
Join Our Telegram Group
")


