#USDCAD @ 1.35260 reverses from intraday low, probes the previous daily loss., @nehcap view: Further downside expected (Pivot Orderbook analysis)
…
This is a premium post.
[s2If !current_user_can(access_s2member_level4)]Please register for PREMIUM VERSION HERE to read full post below containing analysis. In case of any error or you think you are not able to read the full post below, please email us at support#nehcap.com [lwa][/s2If] [s2If current_user_can(access_s2member_level4)]
- USD/CAD reverses from intraday low, probes the previous daily loss.
- Convergence of 200-SMA, three-day-old ascending trend line restricts immediate downside.
- Bulls remain off the table unless crossing the previous support line from November.
- Downbeat RSI line, sustained trading below key trend line, SMA favor sellers.
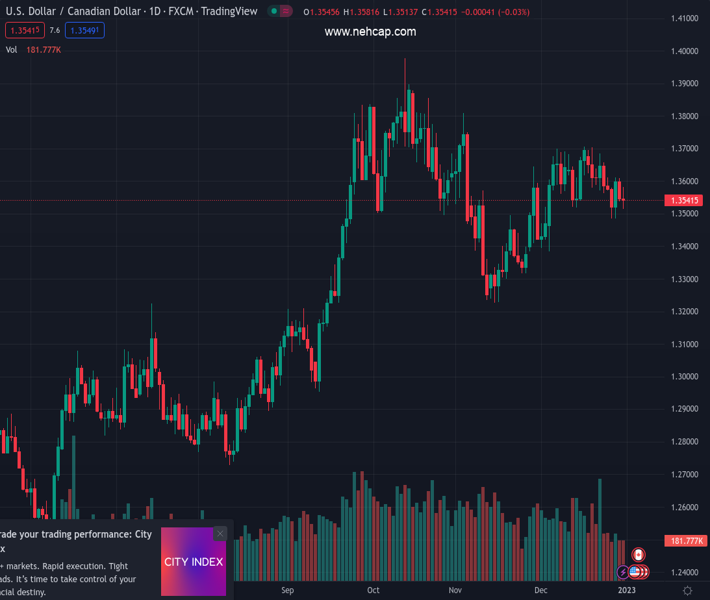
The pair currently trades last at 1.35260.
The previous day high was 1.3582 while the previous day low was 1.3514. The daily 38.2% Fib levels comes at 1.354, expected to provide resistance. Similarly, the daily 61.8% fib level is at 1.3556, expected to provide resistance.
USD/CAD takes a U-turn from the intraday low while picking up bids to 1.3560 amid the holiday-thinned trading session on Monday. In doing so, the Loonie pair bounces off the convergence of the 200-SMA and an upward-sloping support line from the last Wednesday.
That said, the quote’s failure to stay beyond the support-turned-resistance line from November 15, following the previous week’s bounce off the 200-SMA, joins sustained trading below the 50-SMA to keep USD/CAD sellers hopeful.
As a result, the Loonie pair is likely to conquer the 1.3520 support level and aim for the 1.3500 round figure.
However, the double bottom around 1.3485, marked in the last week, will be crucial for the USD/CAD bears to keep the reins.
Following that, the previous monthly low of around 1.3385 could lure the pair sellers ahead of November’s bottom surrounding 1.3225.
Meanwhile, the pair’s recovery moves could aim for the weekly resistance line, around 1.3570, before poking the 50-SMA level surrounding 1.3580.
Though, successful trading beyond the 1.5-month-old support-turned-resistance line, close to 1.3610 at the latest, becomes necessary for the USD/CAD bulls to retake control.
Overall, USD/CAD is likely to remain on the bear’s radar unless even as the downside room is limited.
Trend: Further downside expected
Technical Levels: Supports and Resistances
USDCAD currently trading at 1.356 at the time of writing. Pair opened at 1.354 and is trading with a change of 0.15% % .
| Overview | Overview.1 | |
|---|---|---|
| 0 | Today last price | 1.356 |
| 1 | Today Daily Change | 0.0020 |
| 2 | Today Daily Change % | 0.15% |
| 3 | Today daily open | 1.354 |
The pair is trading below its 20 Daily moving average @ 1.3607, above its 50 Daily moving average @ 1.3527 , above its 100 Daily moving average @ 1.3444 and above its 200 Daily moving average @ 1.3122
| Trends | Trends.1 | |
|---|---|---|
| 0 | Daily SMA20 | 1.3607 |
| 1 | Daily SMA50 | 1.3527 |
| 2 | Daily SMA100 | 1.3444 |
| 3 | Daily SMA200 | 1.3122 |
The previous day high was 1.3582 while the previous day low was 1.3514. The daily 38.2% Fib levels comes at 1.354, expected to provide resistance. Similarly, the daily 61.8% fib level is at 1.3556, expected to provide resistance.
Note the levels of interest below:
- Pivot support is noted at 1.3508, 1.3477, 1.344
- Pivot resistance is noted at 1.3576, 1.3613, 1.3644
| Levels | Levels.1 |
|---|---|
| Previous Daily High | 1.3582 |
| Previous Daily Low | 1.3514 |
| Previous Weekly High | 1.3612 |
| Previous Weekly Low | 1.3484 |
| Previous Monthly High | 1.3705 |
| Previous Monthly Low | 1.3385 |
| Daily Fibonacci 38.2% | 1.3540 |
| Daily Fibonacci 61.8% | 1.3556 |
| Daily Pivot Point S1 | 1.3508 |
| Daily Pivot Point S2 | 1.3477 |
| Daily Pivot Point S3 | 1.3440 |
| Daily Pivot Point R1 | 1.3576 |
| Daily Pivot Point R2 | 1.3613 |
| Daily Pivot Point R3 | 1.3644 |
[/s2If]
Join Our Telegram Group
")


