#NZDUSD @ 0.63190 retraces after hitting 0.6370, as investors’ sentiment remains upbeat. (Pivot Orderbook analysis)
…
This is a premium post.
[s2If !current_user_can(access_s2member_level4)]Please register for PREMIUM VERSION HERE to read full post below containing analysis. In case of any error or you think you are not able to read the full post below, please email us at support#nehcap.com [lwa][/s2If] [s2If current_user_can(access_s2member_level4)]
- NZD/USD retraces after hitting 0.6370, as investors’ sentiment remains upbeat.
- Weaker than expected, China’s PMIs would likely hurt the NZD/USD climbing prospects to the 0.6400 area.
- IMF’s Georgieva:” Global economy faces a tougher year than 2022.”
The pair currently trades last at 0.63190.
The previous day high was 0.6373 while the previous day low was 0.631. The daily 38.2% Fib levels comes at 0.6334, expected to provide resistance. Similarly, the daily 61.8% fib level is at 0.6349, expected to provide resistance.
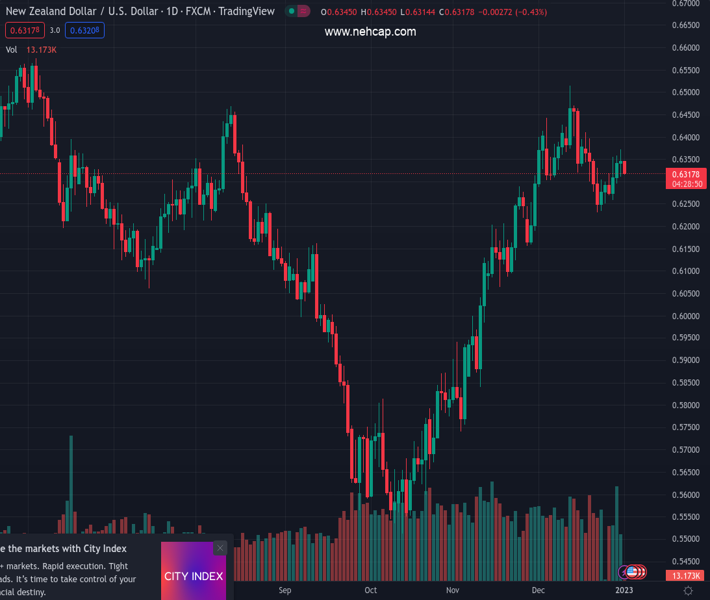
The New Zealand Dollar (NZD) retraces from two-week highs around 0.6370s vs. the USD Dollar (USD) and stumbles to 0.6310s amidst a dull North American session, with US financial markets closed on the observance of new year’s eve. Hence, the NZD/USD drops 0.42% after hitting a daily high of 0.6345, trading at 0.6318.
European equities finished with gains, courtesy of an improvement in market mood. An absent New Zealand and United States (US) economic docket keep most G8 currency pairs within familiar ranges ahead of a pack worldwide economic calendar. Nevertheless, worst than expected, China’s PMIs revealed by the National Bureau of Statistics (NBS) show a gloomy outlook for the second-largest economy in the world. Figures came at 47.0 from 48.0 in November, its most significant drop since the early days of the pandemic.
That said, the NZD/USD pair edged lower, while the US Dollar Index, a gauge of the greenback’s performance against six currencies, advanced 0.14% to 103.63, rebounding at around six-month lows hit during the last week at 103.38.
Aside from this, the International Monetary Fund (IMF) director Kristalina Georgieva said the global economy faces “a tougher year than the year we leave behind.” Georgieva added that 1/3 of the global economy would hit a recession, impacted mainly by the three largest economies, the US, EU, and China, which “are all slowing down simultaneously.”
From a daily chart perspective, the NZD/USD pair remains upward biased, though headed for consolidation, as the 20-day Exponential Moving Average (EMA) at 0.6308 acts like a magnet, dragging the exchange rate toward its price level. Oscillators like the Relative Strength Index (RSI) and the Rate of Change (RoC), aim towards their mid-line, suggesting that buying pressure is easing. But if the NZD/USD pair remains above 0.6300, that could pave the way toward higher prices.
Therefore, the NZD/USD first resistance would be 0.6400. Break above would expose the August 12 daily high of 0.64668, followed by 0.6500.
Technical Levels: Supports and Resistances
NZDUSD currently trading at 0.6316 at the time of writing. Pair opened at 0.6348 and is trading with a change of -0.5 % .
| Overview | Overview.1 | |
|---|---|---|
| 0 | Today last price | 0.6316 |
| 1 | Today Daily Change | -0.0032 |
| 2 | Today Daily Change % | -0.5000 |
| 3 | Today daily open | 0.6348 |
The pair is trading below its 20 Daily moving average @ 0.6346, above its 50 Daily moving average @ 0.616 , above its 100 Daily moving average @ 0.604 and above its 200 Daily moving average @ 0.6241
| Trends | Trends.1 | |
|---|---|---|
| 0 | Daily SMA20 | 0.6346 |
| 1 | Daily SMA50 | 0.6160 |
| 2 | Daily SMA100 | 0.6040 |
| 3 | Daily SMA200 | 0.6241 |
The previous day high was 0.6373 while the previous day low was 0.631. The daily 38.2% Fib levels comes at 0.6334, expected to provide resistance. Similarly, the daily 61.8% fib level is at 0.6349, expected to provide resistance.
Note the levels of interest below:
- Pivot support is noted at 0.6315, 0.6281, 0.6252
- Pivot resistance is noted at 0.6377, 0.6406, 0.644
| Levels | Levels.1 |
|---|---|
| Previous Daily High | 0.6373 |
| Previous Daily Low | 0.6310 |
| Previous Weekly High | 0.6373 |
| Previous Weekly Low | 0.6253 |
| Previous Monthly High | 0.6514 |
| Previous Monthly Low | 0.6230 |
| Daily Fibonacci 38.2% | 0.6334 |
| Daily Fibonacci 61.8% | 0.6349 |
| Daily Pivot Point S1 | 0.6315 |
| Daily Pivot Point S2 | 0.6281 |
| Daily Pivot Point S3 | 0.6252 |
| Daily Pivot Point R1 | 0.6377 |
| Daily Pivot Point R2 | 0.6406 |
| Daily Pivot Point R3 | 0.6440 |
[/s2If]
Join Our Telegram Group
")


