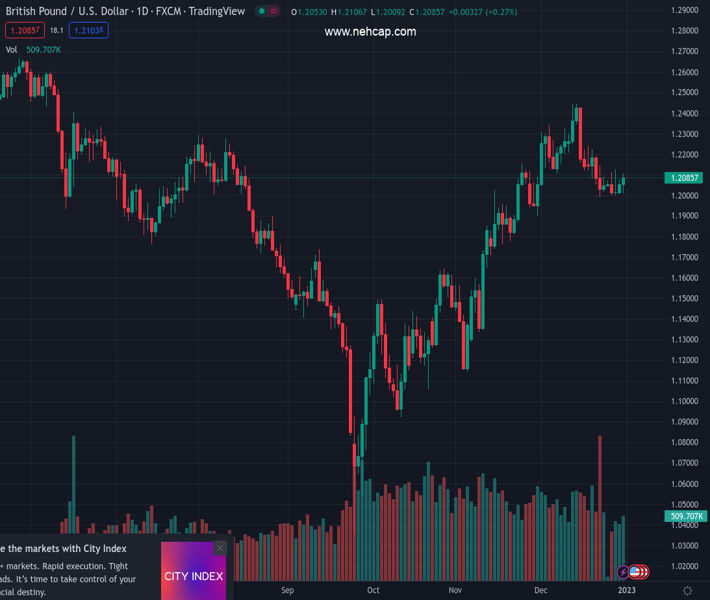
#GBPUSD @ 1.20780 retreats from intraday high to snap two-day uptrend. (Pivot Orderbook analysis)
…
This is a premium post.
[s2If !current_user_can(access_s2member_level4)]Please register for PREMIUM VERSION HERE to read full post below containing analysis. In case of any error or you think you are not able to read the full post below, please email us at support#nehcap.com [lwa][/s2If] [s2If current_user_can(access_s2member_level4)]
- GBP/USD retreats from intraday high to snap two-day uptrend.
- British labor strike, UK PM Sunak’s push back to childcare reform joins geopolitical concerns to weigh on Cable.
- Holidays in UK, US restrict market moves as 2023 begins.
- Final readings of UK PMIs for December, US employment data and FOMC Minutes are this week’s crucial catalysts.
The pair currently trades last at 1.20780.
The previous day high was 1.2108 while the previous day low was 1.201. The daily 38.2% Fib levels comes at 1.207, expected to provide support. Similarly, the daily 61.8% fib level is at 1.2047, expected to provide support.
GBP/USD takes offers to pare intraday gains around 1.2080, teasing bears for the first time in three days, even as the holiday mood limits the Cable pair’s immediate moves.
Multiple negatives surrounding the UK seemed to have lured the GBP/USD bears of late. Among them, British Prime Minister (PM) Rishi Sunak’s shelving of the plans for a major overhaul of the childcare system aimed at saving parents money and helping them return to work, per The Telegraph, gains major attention.
On the same line are the updates surrounding the UK labor strikes as The Times report that the British ministers think unions will run out of money and have to back down but the unions reject the claim, accuse govt of sabotage & say they have financial firepower. Additionally, the UK’s sanctioning of Russian military commanders and Iranian businessmen, as well as the British Defense authorities’ request for more funding, also seemed to have probed the GBP/USD buyers of late.
Elsewhere, downbeat prints of the US data and the year-end consolidation dragged the US Dollar Index (DXY) to refresh a seven-month low the previous day. That said, Chicago Purchasing Managers’ Index crossed the market consensus of 41.2 and the 37.2 previous readings to print the 44.9 figures for December. Even so, the activity gauge signaled contraction for the fourth consecutive month.
Against this backdrop, Wall Street closed with mild losses but the US Treasury bond yields recovered, which in turn probes the GBP/USD bulls who previously held the reins.
Looking forward, a light calendar and off in multiple markets could offer a dull Monday but the British political plays could entertain the GBP/USD pair traders.
For the week, final readings of the UK’s activity numbers for December and the US employment report for the said month will be important for the GBP/USD pair traders to watch for clear directions. Also crucial will be the Minutes of the latest Federal Open Market Committee (FOMC) meeting mid the Fed’s rejection of dovish bias.
Overall, GBP/USD bulls seem to run out of steam but the lack of marker participation seems to limit the pair’s moves.
A 200-SMA level around 1.2100 precedes the stated triangle’s upper line near 1.2110 to restrict short-term advances of the GBP/USD prices. It’s worth noting, however, that the bullish MACD signals and the firmer RSI (14), not overbought, join the 1.2000 psychological magnet to limit the Cable pair’s immediate downside.
Technical Levels: Supports and Resistances
GBPUSD currently trading at 1.2084 at the time of writing. Pair opened at 1.209 and is trading with a change of -0.05% % .
| Overview | Overview.1 | |
|---|---|---|
| 0 | Today last price | 1.2084 |
| 1 | Today Daily Change | -0.0006 |
| 2 | Today Daily Change % | -0.05% |
| 3 | Today daily open | 1.209 |
The pair is trading below its 20 Daily moving average @ 1.2158, above its 50 Daily moving average @ 1.1906 , above its 100 Daily moving average @ 1.1667 and above its 200 Daily moving average @ 1.2046
| Trends | Trends.1 | |
|---|---|---|
| 0 | Daily SMA20 | 1.2158 |
| 1 | Daily SMA50 | 1.1906 |
| 2 | Daily SMA100 | 1.1667 |
| 3 | Daily SMA200 | 1.2046 |
The previous day high was 1.2108 while the previous day low was 1.201. The daily 38.2% Fib levels comes at 1.207, expected to provide support. Similarly, the daily 61.8% fib level is at 1.2047, expected to provide support.
Note the levels of interest below:
- Pivot support is noted at 1.203, 1.1971, 1.1933
- Pivot resistance is noted at 1.2128, 1.2167, 1.2226
| Levels | Levels.1 |
|---|---|
| Previous Daily High | 1.2108 |
| Previous Daily Low | 1.2010 |
| Previous Weekly High | 1.2126 |
| Previous Weekly Low | 1.2002 |
| Previous Monthly High | 1.2447 |
| Previous Monthly Low | 1.1992 |
| Daily Fibonacci 38.2% | 1.2070 |
| Daily Fibonacci 61.8% | 1.2047 |
| Daily Pivot Point S1 | 1.2030 |
| Daily Pivot Point S2 | 1.1971 |
| Daily Pivot Point S3 | 1.1933 |
| Daily Pivot Point R1 | 1.2128 |
| Daily Pivot Point R2 | 1.2167 |
| Daily Pivot Point R3 | 1.2226 |
[/s2If]
Join Our Telegram Group
")


