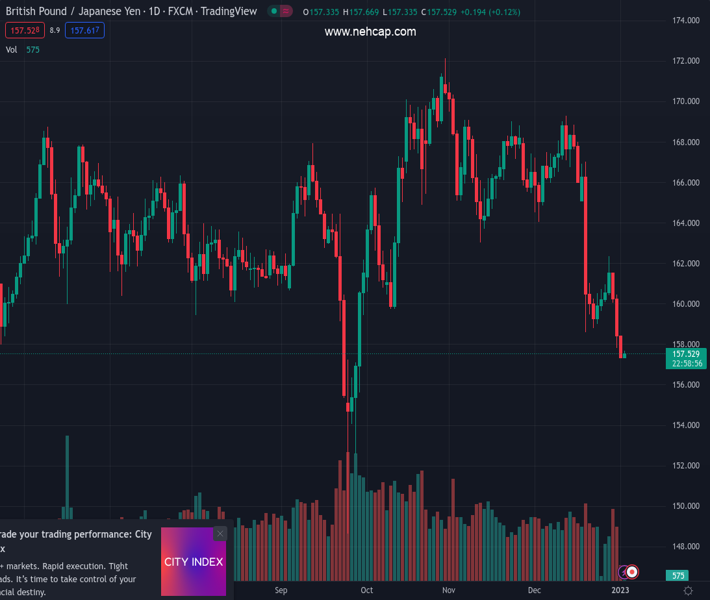
#GBPJPY @ 157.662 drops below a three-month-old upslope trendline, down since last week’s high close of around 3%. (Pivot Orderbook analysis)
…
This is a premium post.
[s2If !current_user_can(access_s2member_level4)]Please register for PREMIUM VERSION HERE to read full post below containing analysis. In case of any error or you think you are not able to read the full post below, please email us at support#nehcap.com [lwa][/s2If] [s2If current_user_can(access_s2member_level4)]
- GBP/JPY drops below a three-month-old upslope trendline, down since last week’s high close of around 3%.
- The RSI at oversold conditions suggests the GBP/JPY could be bottoming, but the RoC suggests that sellers remain in charge.
- GBP/JPY Price Analysis: Break below 157.00 would exacerbate a fall to 154.00.
The pair currently trades last at 157.662.
The previous day high was 160.53 while the previous day low was 157.84. The daily 38.2% Fib levels comes at 158.87, expected to provide resistance. Similarly, the daily 61.8% fib level is at 159.51, expected to provide resistance.
The GBP/JPY plunged more than 100 pips on Monday, extending its losses to three consecutive days, once price action dived below the 200-day Exponential Moving Average (EMA). Furthermore, the cross of the 20-day EMA beneath the 200-day EMA exacerbated the acceleration of the downtrend, as the GBP/JPY gets poised to fall toward the 155.00 mark. At the time of writing, the GBP/JPY is trading at 157.46, below its opening price by 0.69%.
After clearing a three-month-old upslope support trendline drawn from September lows around 148.60s, the GBP/JPY fall increased its velocity. Last Thursday, the GBP/JPY formed a bearish engulfing candle pattern, followed by a tall red candle that cleared on its way south of the 160.00 figure and the previously mentioned trendline. Oscillators like the Relative Strength Index (RSI) entered oversold conditions, while the Rate of Change (RoC) shows that sellers remain gathering momentum. Therefore, the GBP/JPY might continue to fall further.
Therefore the GBP/JPY first support would be the September 29 daily low of 155.60, followed by the 155.00 mark, ahead of the September 27 swing low of 154.07.
As an alternate scenario, if GBP/JPY buyers reclaim 159.00, that could open the door to 160.00, close of the previously mentioned upslope trendline, which would be resistance, ahead of the 20-day EMA at 161.86.
Technical Levels: Supports and Resistances
GBPJPY currently trading at 157.56 at the time of writing. Pair opened at 158.7 and is trading with a change of -0.72 % .
| Overview | Overview.1 | |
|---|---|---|
| 0 | Today last price | 157.56 |
| 1 | Today Daily Change | -1.14 |
| 2 | Today Daily Change % | -0.72 |
| 3 | Today daily open | 158.70 |
The pair remains strongly bearish on the daily time frame. It trades below the 20 SMA @ 164.03, 50 SMA 166.02, 100 SMA @ 164.47 and 200 SMA @ 163.76.
| Trends | Trends.1 | |
|---|---|---|
| 0 | Daily SMA20 | 164.03 |
| 1 | Daily SMA50 | 166.02 |
| 2 | Daily SMA100 | 164.47 |
| 3 | Daily SMA200 | 163.76 |
The previous day high was 160.53 while the previous day low was 157.84. The daily 38.2% Fib levels comes at 158.87, expected to provide resistance. Similarly, the daily 61.8% fib level is at 159.51, expected to provide resistance.
Note the levels of interest below:
- Pivot support is noted at 157.52, 156.33, 154.82
- Pivot resistance is noted at 160.21, 161.72, 162.9
| Levels | Levels.1 |
|---|---|
| Previous Daily High | 160.53 |
| Previous Daily Low | 157.84 |
| Previous Weekly High | 162.34 |
| Previous Weekly Low | 157.84 |
| Previous Monthly High | 169.28 |
| Previous Monthly Low | 157.84 |
| Daily Fibonacci 38.2% | 158.87 |
| Daily Fibonacci 61.8% | 159.51 |
| Daily Pivot Point S1 | 157.52 |
| Daily Pivot Point S2 | 156.33 |
| Daily Pivot Point S3 | 154.82 |
| Daily Pivot Point R1 | 160.21 |
| Daily Pivot Point R2 | 161.72 |
| Daily Pivot Point R3 | 162.90 |
[/s2If]
Join Our Telegram Group
")


