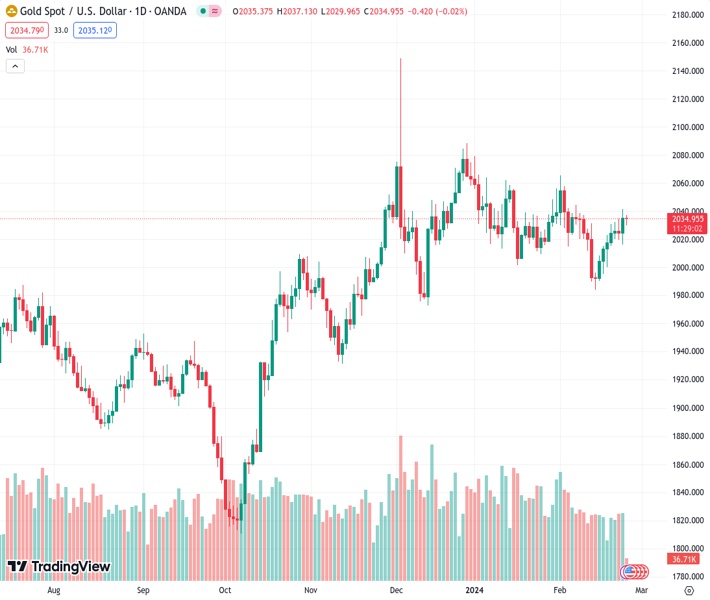
Gold price remains in a tight range, slightly above $2,030, as the US Dollar trades sideways.
…
This is a premium post.
[s2If !current_user_can(access_s2member_level4)]Please register for FREE REGISTER to read full post below containing analysis. In case of any error or you think you are not able to read the full post below, please email us at support#nehcap.com [lwa][/s2If] [s2If current_user_can(access_s2member_level1)]
- Gold price remains in a tight range, slightly above $2,030, as the US Dollar trades sideways.
- Fed Williams said interest-rate cuts are likely later this year.
- Investors await the US core PCE inflation data for fresh guidance.
Gold price (XAU/USD) consolidates in a strict range in Monday’s European session as investors are sidelined ahead of crucial economic releases this week. The upside in the Gold price remains restricted due to the Federal Reserve’s (Fed) hawkish narrative on interest rates, while tensions surrounding the Middle East crisis have capped the downside.
Fed policymakers have been reiterating that interest-rate cuts are likely later this year. However, no one is providing a detailed time frame as officials still lack evidence that inflation will sustainably come down to the 2% target.
The muted performance in the Gold price is also linked to the US Dollar, which has been trading broadly sideways as investors shift their focus towards the US core Personal Consumption Expenditure (PCE) Price Index data for January. The Fed’s preferred inflation gauge, which will be published on Thursday, will likely influence market expectations for rate cuts. The US Dollar Index (DXY), which tracks the Greenback’s value against six major currencies, trades close to 103.80.
Gold price trades in a narrow range above $2,030 as investors await more guidance on interest rates. The near-term trend is slightly bullish as Gold is trading above the 20-day and 50-day Exponential Moving Averages (EMAs), which are around $2,020.
The yellow metal trades in a Symmetrical Triangle chart pattern formed on a daily time frame. The precious metal is gradually approaching the downward-sloping border of the aforementioned pattern, which is plotted from the December 28 high at $2,088. The upward-sloping border of the chart pattern is placed from the December 13 low at $1,973.
The triangle could break out in either direction. However, the odds marginally favor a move in the direction of the trend before the formation of the triangle – in this case, up. A decisive break above or below the triangle boundary lines would indicate a breakout is underway.
The 14-period Relative Strength Index (RSI) oscillates in the 40.00-60.00 region, which indicates indecisiveness among investors.
[/s2If]
Nehcap Trading Strategies
The NEHCAP currently runs the following trading systems for clients. They can be bought and run on your funds.
The system is trading live: LIVE ACCOUNT TRACKING
Contact Us: Contact
The HFT_FIX can be run free for 2 weeks on any broker with a ECN. Apply for a free trial
Join Our Telegram Group
")


