Gold price jumps higher as Middle East tensions deepen.
…
This is a premium post.
[s2If !current_user_can(access_s2member_level4)]Please register for FREE REGISTER to read full post below containing analysis. In case of any error or you think you are not able to read the full post below, please email us at support#nehcap.com [lwa][/s2If] [s2If current_user_can(access_s2member_level1)]
- Gold price jumps higher as Middle East tensions deepen.
- The US Dollar tumbles despite FOMC minutes indicating a hawkish narrative.
- Investors await US S&P Global PMI data, which will shed some light on the economic outlook.
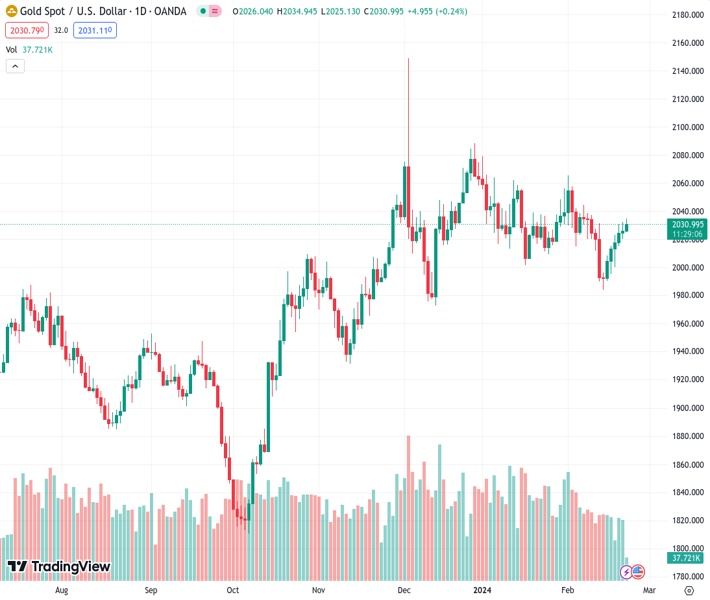
Gold price (XAU/USD) prints a fresh weekly high above $2,030 in Thursday’s European session. The precious metal extends its winning streak to the sixth trading session amid a weak outlook for the US Dollar and escalating Middle East tensions. Generally, the appeal for safe-haven assets such as Gold improves during geopolitical uncertainty.
The US Dollar is under pressure even though the Federal Open Market Committee (FOMC) Minutes of the late January policy meeting indicated that the majority of Federal Reserve (Fed) policymakers are in no hurry to unwind the restrictive monetary policy stance.
Fed policymakers are expected to keep interest rates unchanged in the range of 5.25%-5.50% until they get convinced that price stability can be achieved. Easing price pressures for some months could build confidence among Fed policymakers that inflation will sustainably decline to the 2% target.
On the geopolitical front, Middle East tensions have escalated as Israel intensifies its attacks in Rafah, which is a Palestinian city at the southern end of Gaza. Last week, Israeli Defense Minister Yoav Gallant identified Rafah as a shelter for over 1.4 million Palestinian refugees.
Gold price extends its winning spell to the sixth day as geopolitical uncertainty deepens. The precious metal has printed a fresh 10-day high near $2,035. The yellow metal is expeditiously approaching the downward-sloping border of the Symmetrical Triangle chart pattern formed on a daily time frame, which is plotted from the December 28 high at $2,088. The upward-sloping border of the aforementioned chart pattern is placed from the December 13 low at $1,973.
The triangle could break out in either direction. However, the odds marginally favor a move in the direction of the trend before the formation of the triangle – in this case up. A decisive break above or below the triangle boundary lines would indicate a breakout is underway.
The 14-period Relative Strength Index (RSI) marches toward 60.00. If the RSI manages to climb above the same, a bullish momentum will be activated.
[/s2If]
Nehcap Trading Strategies
The NEHCAP currently runs the following trading systems for clients. They can be bought and run on your funds.
The system is trading live: LIVE ACCOUNT TRACKING
Contact Us: Contact
The HFT_FIX can be run free for 2 weeks on any broker with a ECN. Apply for a free trial
Join Our Telegram Group
")


