WTI prices drift higher to the $78.00 mark amid the ongoing Middle East geopolitical conflicts. (Pivot Orderbook analysis)
…
This is a premium post.
[s2If !current_user_can(access_s2member_level4)]Please register for FREE REGISTER to read full post below containing analysis. In case of any error or you think you are not able to read the full post below, please email us at support#nehcap.com [lwa][/s2If] [s2If current_user_can(access_s2member_level1)]
- WTI prices drift higher to the $78.00 mark amid the ongoing Middle East geopolitical conflicts.
- The January FOMC Minutes indicated that interest rates in the US are likely to reach their peak.
- Crude oil inventories in the US last week rose by 7.168 million barrels vs. 8.52 million barrels prior.
The pair currently trades last at 77.96.
The previous day high was 77.92 while the previous day low was 76.26. The daily 38.2% Fib levels comes at 77.29, expected to provide support. Similarly, the daily 61.8% fib level is at 76.89, expected to provide support.
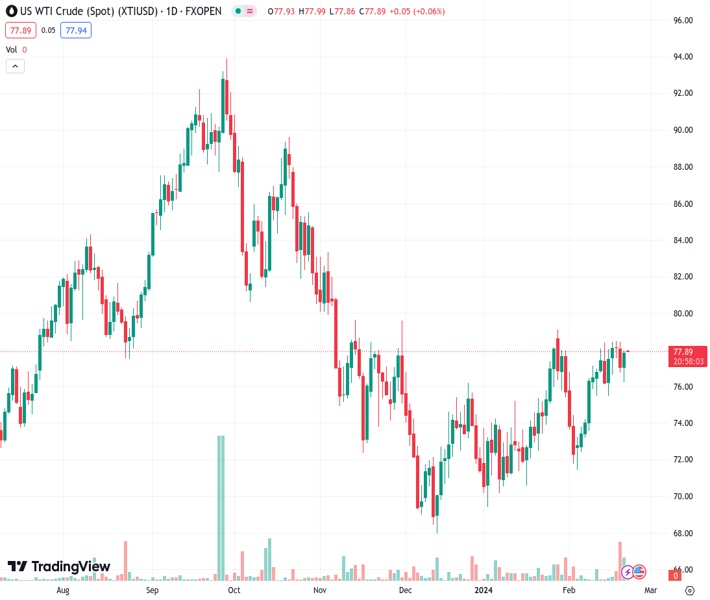
Western Texas Intermediate (WTI), the US crude oil benchmark, is trading around $78.00 on Thursday. WTI prices edge higher as Federal Reserve (Fed) officials indicated that interest rates have likely reached their peak and the escalating geopolitical tensions in the Middle East continue to impact the supplies of crude oil.
According to the FOMC Minutes for the January meeting, Fed officials agreed that interest rates in the US have likely peaked while adding that rates should not be cut until they had more confidence that inflation returns to the central bank target sustainably. Investors anticipate the first rate cuts in the June meeting rather than in the March or May meeting. It’s worth noting that lower interest rates typically stimulate economic growth, thereby bolstering the demand for WTI.
About a data, crude oil inventories in the US for the week ending February 16 rose by 7.168 million barrels from the previous week of 8.52 million barrels, according to the American Petroleum Institute (API) report on Wednesday.
Israel launched airstrikes against Hezbollah in Lebanon and Houthi attacks on another commercial vessel in the Red Sea on Monday. The United States has advised Israel against launching a ground attack in Rafah without a strategy to safeguard civilians. The rising tension in the Middle East might raise concern about the supplies of crude oil, which boosts WTI prices.
Oil traders will focus on the US S&P Global Services Purchasing Managers Index (PMI) for February and the Energy Information Administration (EIA) Crude Oil stockpiles report is due on Thursday. These events could significantly impact the USD-denominated WTI price. Oil traders will take cues from the data and find trading opportunities around WTI prices.
Technical Levels: Supports and Resistances
XTIUSD currently trading at 77.96 at the time of writing. Pair opened at 77.91 and is trading with a change of 0.06 % .
| Overview | Overview.1 | |
|---|---|---|
| 0 | Today last price | 77.96 |
| 1 | Today Daily Change | 0.05 |
| 2 | Today Daily Change % | 0.06 |
| 3 | Today daily open | 77.91 |
The pair remains strongly bullish on the daily timeframe. It trades above its 20 SMA @ 76.25, 50 SMA 74.3, 100 SMA @ 76.64 and 200 SMA @ 77.55.
| Trends | Trends.1 | |
|---|---|---|
| 0 | Daily SMA20 | 76.25 |
| 1 | Daily SMA50 | 74.30 |
| 2 | Daily SMA100 | 76.64 |
| 3 | Daily SMA200 | 77.55 |
The previous day high was 77.92 while the previous day low was 76.26. The daily 38.2% Fib levels comes at 77.29, expected to provide support. Similarly, the daily 61.8% fib level is at 76.89, expected to provide support.
Note the levels of interest below:
- Pivot support is noted at 76.8, 75.69, 75.13
- Pivot resistance is noted at 78.47, 79.03, 80.14
| Levels | Levels.1 |
|---|---|
| Previous Daily High | 77.92 |
| Previous Daily Low | 76.26 |
| Previous Weekly High | 78.47 |
| Previous Weekly Low | 75.51 |
| Previous Monthly High | 79.19 |
| Previous Monthly Low | 69.41 |
| Daily Fibonacci 38.2% | 77.29 |
| Daily Fibonacci 61.8% | 76.89 |
| Daily Pivot Point S1 | 76.80 |
| Daily Pivot Point S2 | 75.69 |
| Daily Pivot Point S3 | 75.13 |
| Daily Pivot Point R1 | 78.47 |
| Daily Pivot Point R2 | 79.03 |
| Daily Pivot Point R3 | 80.14 |
[/s2If]
Nehcap Trading Strategies
The NEHCAP currently runs the following trading systems for clients. They can be bought and run on your funds.
The system is trading live: LIVE ACCOUNT TRACKING
Contact Us: Contact
The HFT_FIX can be run free for 2 weeks on any broker with a ECN. Apply for a free trial
Join Our Telegram Group
")


