WTI climbed back towards $78.00 per barrel on Wednesday. (Pivot Orderbook analysis)
…
This is a premium post.
[s2If !current_user_can(access_s2member_level4)]Please register for FREE REGISTER to read full post below containing analysis. In case of any error or you think you are not able to read the full post below, please email us at support#nehcap.com [lwa][/s2If] [s2If current_user_can(access_s2member_level1)]
- WTI climbed back towards $78.00 per barrel on Wednesday.
- API US barrel counts lurched higher once more.
- Geopolitical concerns and hopes of refinery expansion keep barrel bids high.
The pair currently trades last at 77.94.
The previous day high was 78.48 while the previous day low was 76.77. The daily 38.2% Fib levels comes at 77.42, expected to provide support. Similarly, the daily 61.8% fib level is at 77.82, expected to provide support.
West Texas Intermediate (WTI) US Crude Oil rebounded on Wednesday as barrel traders continue to price in possible supply lane constraints amidst geopolitical turmoil in the Middle East. Hopes of expanded US refinery activity eating away at a buildup of US Crude Oil supplies are also keeping barrel prices higher, but a growing overhang of US barrel counts is getting harder for energy markets to ignore.
According to the American Petroleum Insitute (API), US Crude Oil supply stocks unexpectedly rose once again for the week ended February 16, with an additional 7.168 million barrels added to US supply. This comes well above the forecast 4.298 million barrels and adds even further to the previous week’s surprise glut of 8.52 million barrels.
According to API barrel counts, US Crude Oil supplies are up an excess of nearly 18 million barrels since the week ended November 2.
US Crude Oil refineries have been slowly coming back online since overall refined petroleum product output declined in 2022 as several refineries went offline for overhauls, upgrades, or security concerns. Barrel traders are betting on an uptick in US refining capacity to eat away at record Crude Oil production within the US and other countries that are not part of the Organization of the Petroleum Exporting Countries (OPEC).
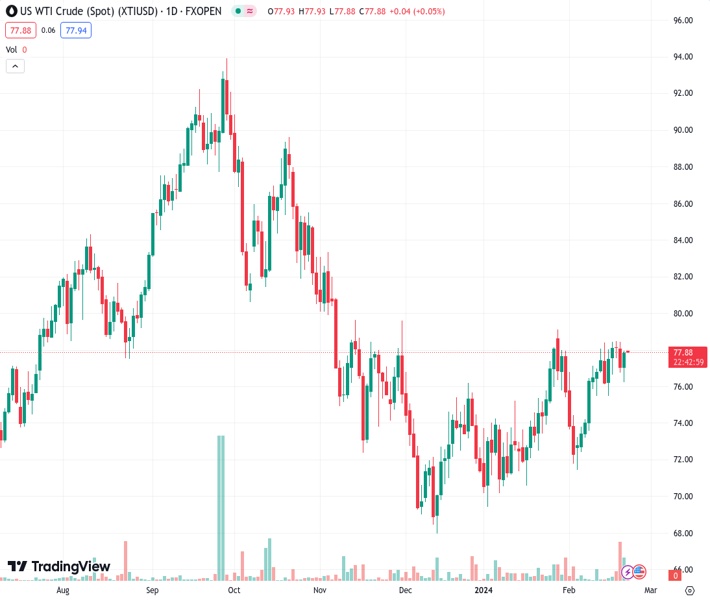
WTI US Crude Oil climbed over 2% bottom-to-top from Wednesday’s low bids near $76.25, and WTI is climbing towards $78.00 per barrel as energy markets pin back into near-term highs.
Daily candlesticks show US Crude Oil in a notably sideways bent as bids knock into the 200-day Simple Moving Average (SMA) near $77.55. WTI has failed to pierce into fresh high ground since peaking at $79.20 in January, and Crude Oil longs are struggling to drag WTI further into bull country after barrel prices bottomed out in December at $67.97.
WTI peaked just shy of $94.00 per barrel last September, and remains down over 17% from that high.
Technical Levels: Supports and Resistances
XTIUSD currently trading at 77.94 at the time of writing. Pair opened at 77.13 and is trading with a change of 1.05 % .
| Overview | Overview.1 | |
|---|---|---|
| 0 | Today last price | 77.94 |
| 1 | Today Daily Change | 0.81 |
| 2 | Today Daily Change % | 1.05 |
| 3 | Today daily open | 77.13 |
The pair remains strongly bullish on the daily timeframe. It trades above its 20 SMA @ 76.12, 50 SMA 74.14, 100 SMA @ 76.7 and 200 SMA @ 77.52.
| Trends | Trends.1 | |
|---|---|---|
| 0 | Daily SMA20 | 76.12 |
| 1 | Daily SMA50 | 74.14 |
| 2 | Daily SMA100 | 76.70 |
| 3 | Daily SMA200 | 77.52 |
The previous day high was 78.48 while the previous day low was 76.77. The daily 38.2% Fib levels comes at 77.42, expected to provide support. Similarly, the daily 61.8% fib level is at 77.82, expected to provide support.
Note the levels of interest below:
- Pivot support is noted at 76.44, 75.75, 74.74
- Pivot resistance is noted at 78.15, 79.17, 79.86
| Levels | Levels.1 |
|---|---|
| Previous Daily High | 78.48 |
| Previous Daily Low | 76.77 |
| Previous Weekly High | 78.47 |
| Previous Weekly Low | 75.51 |
| Previous Monthly High | 79.19 |
| Previous Monthly Low | 69.41 |
| Daily Fibonacci 38.2% | 77.42 |
| Daily Fibonacci 61.8% | 77.82 |
| Daily Pivot Point S1 | 76.44 |
| Daily Pivot Point S2 | 75.75 |
| Daily Pivot Point S3 | 74.74 |
| Daily Pivot Point R1 | 78.15 |
| Daily Pivot Point R2 | 79.17 |
| Daily Pivot Point R3 | 79.86 |
[/s2If]
Nehcap Trading Strategies
The NEHCAP currently runs the following trading systems for clients. They can be bought and run on your funds.
The system is trading live: LIVE ACCOUNT TRACKING
Contact Us: Contact
The HFT_FIX can be run free for 2 weeks on any broker with a ECN. Apply for a free trial
Join Our Telegram Group
")


