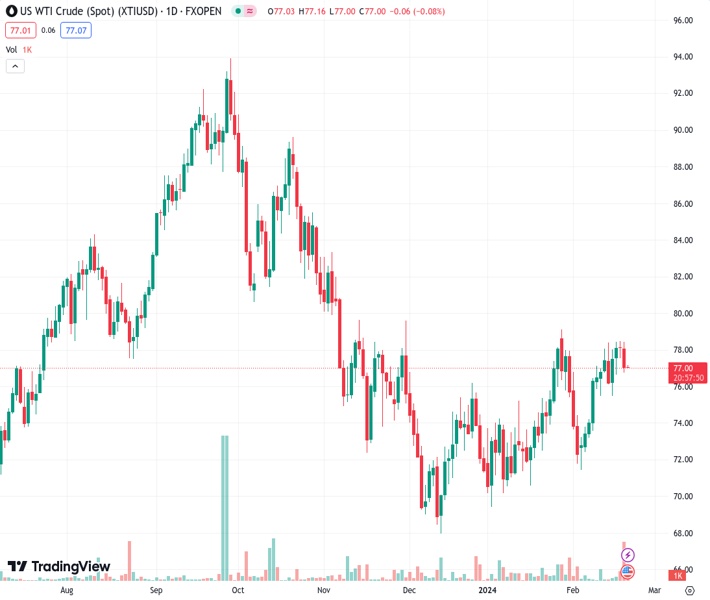
WTI edges lower to $77.10 after reaching a three-month high last week. (Pivot Orderbook analysis)
…
This is a premium post.
[s2If !current_user_can(access_s2member_level4)]Please register for FREE REGISTER to read full post below containing analysis. In case of any error or you think you are not able to read the full post below, please email us at support#nehcap.com [lwa][/s2If] [s2If current_user_can(access_s2member_level1)]
- WTI edges lower to $77.10 after reaching a three-month high last week.
- Concerns around global oil demand from the IEA could drag the oil price lower.
- The rising Middle East geopolitical conflicts might cap the downside of WTI.
The pair currently trades last at 77.09.
The previous day high was 78.48 while the previous day low was 76.77. The daily 38.2% Fib levels comes at 77.42, expected to provide resistance. Similarly, the daily 61.8% fib level is at 77.82, expected to provide resistance.
Western Texas Intermediate (WTI), the US crude oil benchmark, is trading around $77.10 on Wednesday. WTI prices edge lower as traders take profits from the crude oil uptick this month. However, the escalating geopolitical tensions in the Middle East might cap the downside of WTI prices.
Last week, the International Energy Agency (IEA) revised the 2024 oil demand growth prediction downward. The IEA expected global oil demand will grow by 1.22 million barrels per day (bpd) this year, less than OPEC’s forecast of 2.25 million bpd. That being said, worries about global demand drag WTI prices lower.
On the other hand, the rising geopolitical conflict in the Middle East might lift the black gold and cap the downside. Israel carried out attacks in Lebanon and pledged to continue its attacks in Gaza, targeting the southern city of Rafah. On Monday, Houthi militants attacked another commercial ship in the Bab el-Mandeb strait, forcing the crew to abandon the vessel.
Oil traders will monitor the EIA Crude Oil Stocks Change and API Weekly Crude Oil Stock, due on Wednesday and Thursday, respectively. The highlight will be the FOMC Minutes on Wednesday, which might provide insight into the path to interest rate cuts and the current policy stance of the US Federal Reserve (Fed). These events could significantly impact the USD-denominated WTI price. Oil traders will take cues from the data and find trading opportunities around WTI prices.
Technical Levels: Supports and Resistances
XTIUSD currently trading at 77.09 at the time of writing. Pair opened at 77.13 and is trading with a change of -0.05 % .
| Overview | Overview.1 | |
|---|---|---|
| 0 | Today last price | 77.09 |
| 1 | Today Daily Change | -0.04 |
| 2 | Today Daily Change % | -0.05 |
| 3 | Today daily open | 77.13 |
The pair is trading above its 20 Daily moving average @ 76.12, above its 50 Daily moving average @ 74.14 , above its 100 Daily moving average @ 76.7 and below its 200 Daily moving average @ 77.52
| Trends | Trends.1 | |
|---|---|---|
| 0 | Daily SMA20 | 76.12 |
| 1 | Daily SMA50 | 74.14 |
| 2 | Daily SMA100 | 76.70 |
| 3 | Daily SMA200 | 77.52 |
The previous day high was 78.48 while the previous day low was 76.77. The daily 38.2% Fib levels comes at 77.42, expected to provide resistance. Similarly, the daily 61.8% fib level is at 77.82, expected to provide resistance.
Note the levels of interest below:
- Pivot support is noted at 76.44, 75.75, 74.74
- Pivot resistance is noted at 78.15, 79.17, 79.86
| Levels | Levels.1 |
|---|---|
| Previous Daily High | 78.48 |
| Previous Daily Low | 76.77 |
| Previous Weekly High | 78.47 |
| Previous Weekly Low | 75.51 |
| Previous Monthly High | 79.19 |
| Previous Monthly Low | 69.41 |
| Daily Fibonacci 38.2% | 77.42 |
| Daily Fibonacci 61.8% | 77.82 |
| Daily Pivot Point S1 | 76.44 |
| Daily Pivot Point S2 | 75.75 |
| Daily Pivot Point S3 | 74.74 |
| Daily Pivot Point R1 | 78.15 |
| Daily Pivot Point R2 | 79.17 |
| Daily Pivot Point R3 | 79.86 |
[/s2If]
Nehcap Trading Strategies
The NEHCAP currently runs the following trading systems for clients. They can be bought and run on your funds.
The system is trading live: LIVE ACCOUNT TRACKING
Contact Us: Contact
The HFT_FIX can be run free for 2 weeks on any broker with a ECN. Apply for a free trial
Join Our Telegram Group
")


