Crude Oil markets are betting on seasonal demand increases to offset supply builds. (Pivot Orderbook analysis)
…
This is a premium post.
[s2If !current_user_can(access_s2member_level4)]Please register for FREE REGISTER to read full post below containing analysis. In case of any error or you think you are not able to read the full post below, please email us at support#nehcap.com [lwa][/s2If] [s2If current_user_can(access_s2member_level1)]
- Crude Oil markets are betting on seasonal demand increases to offset supply builds.
- Geopolitical headlines from the Middle East continue to put a floor under barrel bids.
- A split in demand growth projections has Crude Oil markets facing diverging outlooks.
The pair currently trades last at 78.21.
The previous day high was 78.05 while the previous day low was 75.51. The daily 38.2% Fib levels comes at 77.08, expected to provide support. Similarly, the daily 61.8% fib level is at 76.48, expected to provide support.
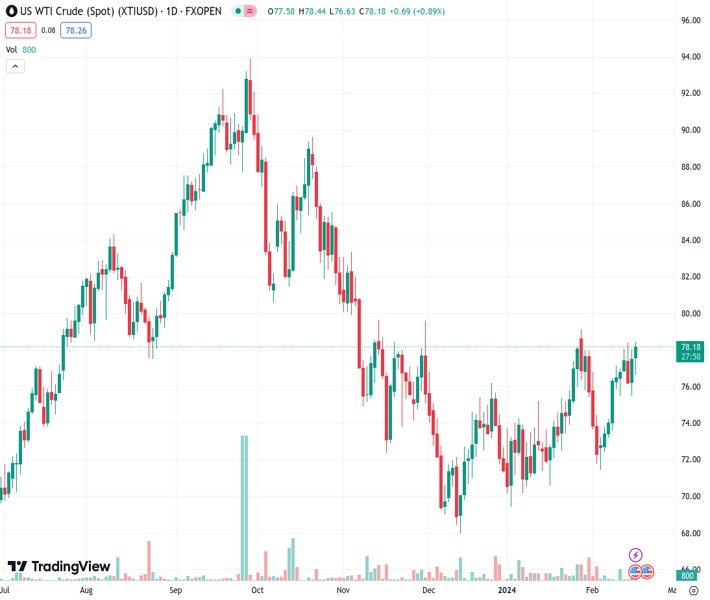
West Texas Intermediate (WTI) US Crude Oil extended a near-term rebound to claw back the $78.00 handle on Friday, driving back into a notable technical zone heading into Friday’s closing bell.
The Gaza conflict between Israel and Palestinian Hamas still hasn’t seen a resolution or significant progress on a hotly-negotiated ceasefire, keeping energy markets nervous about potential spillover into neighboring Crude Oil production-heavy nations like Iran. Houthi rebels in Yemen continue to target civilian cargo ships in the Red Sea bound for the Suez Canal, helping to keep fears of potential supply disruptions elevated.
The Organization of the Petroleum Exporting Countries (OPEC) firmly believes that global Crude Oil demand will continue to grow for the next two decades, but that perspective is being challenged by the International Energy Agency, which is forecasting that global demand will flag in the coming months. The IEA’s forecasts expect global Crude Oil demand growth to slow to 1.22 million barrels per day, while OPEC expects a long-term growth increase of over double that figure.
WTI US Crude Oil traders shrugged off the IEA’s warning flashed this week, as well as another surprise buildup in US Crude Oil barrel counts. Investors predominantly focused on geopolitical headlines this week, as well as a larger-than-expected drawdown in refined and downstream oil products.
WTI saw its highest bids in nearly three weeks on Friday, testing into $78.40 before wrapping up the week’s trading near $78.20 at Friday’s closing bell. Near-term momentum is healthily bullish with the 200-hour Simple Moving Average (SMA) climbing into $76.10 and bolstering intraday technical patterns from below.
Daily candlesticks see WTI poised for a firm breakout to the high side of the 200-day SMA near $77.45, but bulls will need to stage a decidedly firm break of January’s peak of $79.20 before taking a run at the $80.00 handle.
Technical Levels: Supports and Resistances
XTIUSD currently trading at 78.21 at the time of writing. Pair opened at 77.64 and is trading with a change of 0.73 % .
| Overview | Overview.1 | |
|---|---|---|
| 0 | Today last price | 78.21 |
| 1 | Today Daily Change | 0.57 |
| 2 | Today Daily Change % | 0.73 |
| 3 | Today daily open | 77.64 |
The pair remains strongly bullish on the daily timeframe. It trades above its 20 SMA @ 75.58, 50 SMA 73.71, 100 SMA @ 77.02 and 200 SMA @ 77.41.
| Trends | Trends.1 | |
|---|---|---|
| 0 | Daily SMA20 | 75.58 |
| 1 | Daily SMA50 | 73.71 |
| 2 | Daily SMA100 | 77.02 |
| 3 | Daily SMA200 | 77.41 |
The previous day high was 78.05 while the previous day low was 75.51. The daily 38.2% Fib levels comes at 77.08, expected to provide support. Similarly, the daily 61.8% fib level is at 76.48, expected to provide support.
Note the levels of interest below:
- Pivot support is noted at 76.09, 74.53, 73.56
- Pivot resistance is noted at 78.62, 79.6, 81.16
| Levels | Levels.1 |
|---|---|
| Previous Daily High | 78.05 |
| Previous Daily Low | 75.51 |
| Previous Weekly High | 77.18 |
| Previous Weekly Low | 71.46 |
| Previous Monthly High | 79.19 |
| Previous Monthly Low | 69.41 |
| Daily Fibonacci 38.2% | 77.08 |
| Daily Fibonacci 61.8% | 76.48 |
| Daily Pivot Point S1 | 76.09 |
| Daily Pivot Point S2 | 74.53 |
| Daily Pivot Point S3 | 73.56 |
| Daily Pivot Point R1 | 78.62 |
| Daily Pivot Point R2 | 79.60 |
| Daily Pivot Point R3 | 81.16 |
[/s2If]
Nehcap Trading Strategies
The NEHCAP currently runs the following trading systems for clients. They can be bought and run on your funds.
The system is trading live: LIVE ACCOUNT TRACKING
Contact Us: Contact
The HFT_FIX can be run free for 2 weeks on any broker with a ECN. Apply for a free trial
Join Our Telegram Group
")


