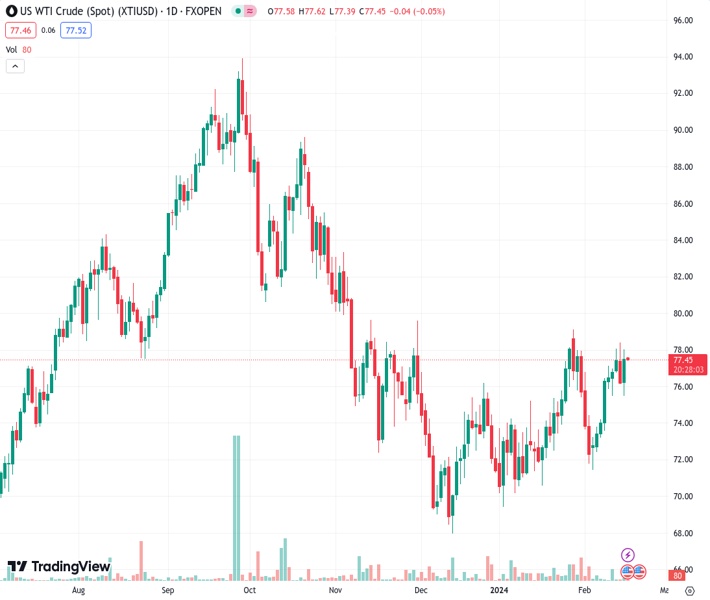
WTI recovers to $77.50 on the weaker of the US Dollar. (Pivot Orderbook analysis)
…
This is a premium post.
[s2If !current_user_can(access_s2member_level4)]Please register for FREE REGISTER to read full post below containing analysis. In case of any error or you think you are not able to read the full post below, please email us at support#nehcap.com [lwa][/s2If] [s2If current_user_can(access_s2member_level1)]
- WTI recovers to $77.50 on the weaker of the US Dollar.
- The International Energy Agency (IEA) said the crude market could be in surplus throughout 2024.
- The escalating Middle East geopolitical tension might lift WTI prices as it disrupts crude supplies.
- Oil traders will monitor the US January Producer Price Index (PPI), due on Friday.
The pair currently trades last at 77.46.
The previous day high was 78.05 while the previous day low was 75.51. The daily 38.2% Fib levels comes at 77.08, expected to provide support. Similarly, the daily 61.8% fib level is at 76.48, expected to provide support.
Western Texas Intermediate (WTI), the US crude oil benchmark, is trading around $77.50 on Friday. WTI prices edge higher after the weaker-than-expected US Retail Sales data raise hope that the Federal Reserve (Fed) will soon start cutting interest rates in coming months.
On Thursday, the US Retail Sales for January fell 0.8% MoM from a 0.4% rise in the previous reading, below the market consensus 0.1% decline. That being said, lower interest rates have caused oil prices to rise which translates to more demand for oil as activity increases with lower costs.
Meanwhile, the rising geopolitical tension in the Middle East might boost WTI prices as it disrupts crude supplies Israel launched extensive and lethal airstrikes in southern Lebanon on Wednesday, in response to a deadly missile attack on northern Israel. Israeli leaders have warned that they would take considerably stronger military action in Lebanon if the cross-border violence continues.
On the other hand, the International Energy Agency (IEA) expects that the crude oil will be in excess in 2024. The IEA stated that global oil consumption would rise by +1.2 million bpd in 2024, almost half the pace seen last year. This, in turn, might cap the upside of WTI prices.
Oil traders will keep an eye on the US Producer Price Index (PPI) for January on Friday. Later in the day, the Fed’s Barr and Daly are set to speak. These events could significantly impact the USD-denominated WTI price. Oil traders will take cues from the data and find trading opportunities around WTI prices.
Technical Levels: Supports and Resistances
XTIUSD currently trading at 77.46 at the time of writing. Pair opened at 77.64 and is trading with a change of -0.23 % .
| Overview | Overview.1 | |
|---|---|---|
| 0 | Today last price | 77.46 |
| 1 | Today Daily Change | -0.18 |
| 2 | Today Daily Change % | -0.23 |
| 3 | Today daily open | 77.64 |
The pair remains strongly bullish on the daily timeframe. It trades above its 20 SMA @ 75.58, 50 SMA 73.71, 100 SMA @ 77.02 and 200 SMA @ 77.41.
| Trends | Trends.1 | |
|---|---|---|
| 0 | Daily SMA20 | 75.58 |
| 1 | Daily SMA50 | 73.71 |
| 2 | Daily SMA100 | 77.02 |
| 3 | Daily SMA200 | 77.41 |
The previous day high was 78.05 while the previous day low was 75.51. The daily 38.2% Fib levels comes at 77.08, expected to provide support. Similarly, the daily 61.8% fib level is at 76.48, expected to provide support.
Note the levels of interest below:
- Pivot support is noted at 76.09, 74.53, 73.56
- Pivot resistance is noted at 78.62, 79.6, 81.16
| Levels | Levels.1 |
|---|---|
| Previous Daily High | 78.05 |
| Previous Daily Low | 75.51 |
| Previous Weekly High | 77.18 |
| Previous Weekly Low | 71.46 |
| Previous Monthly High | 79.19 |
| Previous Monthly Low | 69.41 |
| Daily Fibonacci 38.2% | 77.08 |
| Daily Fibonacci 61.8% | 76.48 |
| Daily Pivot Point S1 | 76.09 |
| Daily Pivot Point S2 | 74.53 |
| Daily Pivot Point S3 | 73.56 |
| Daily Pivot Point R1 | 78.62 |
| Daily Pivot Point R2 | 79.60 |
| Daily Pivot Point R3 | 81.16 |
[/s2If]
Nehcap Trading Strategies
The NEHCAP currently runs the following trading systems for clients. They can be bought and run on your funds.
The system is trading live: LIVE ACCOUNT TRACKING
Contact Us: Contact
The HFT_FIX can be run free for 2 weeks on any broker with a ECN. Apply for a free trial
Join Our Telegram Group
")


