Crude Oil markets recovered after Wednesday’s decline as barrel bids rebound. (Pivot Orderbook analysis)
…
This is a premium post.
[s2If !current_user_can(access_s2member_level4)]Please register for FREE REGISTER to read full post below containing analysis. In case of any error or you think you are not able to read the full post below, please email us at support#nehcap.com [lwa][/s2If] [s2If current_user_can(access_s2member_level1)]
- Crude Oil markets recovered after Wednesday’s decline as barrel bids rebound.
- WTI shrugs off warnings that global oil demand is set to peak according to the EIA.
- Crude Oil demand estimates have deviated wildly.
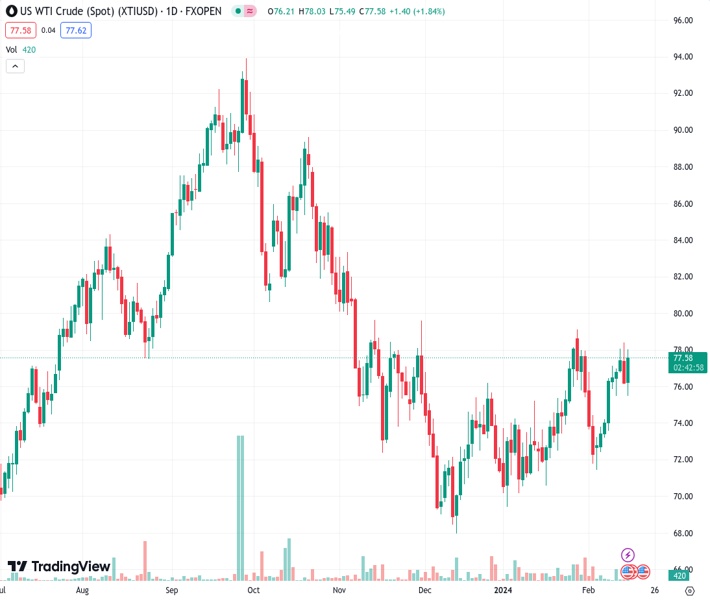
The pair currently trades last at 77.59.
The previous day high was 78.43 while the previous day low was 76.12. The daily 38.2% Fib levels comes at 77.0, expected to provide support. Similarly, the daily 61.8% fib level is at 77.55, expected to provide support.
West Texas Intermediate (WTI) Crude Oil rebounded on Thursday, catching an upshot into $77.50 per barrel and slamming back into a technical congestion zone on the charts as energy market bid Crude Oil back up after a midweek pullback. Crude Oil supply lines saw an unexpected uptick in barrel counts this week, warning barrel traders that global supply continues to climb at a much faster pace than energy markets initially expected.
According to the International Energy Agency (IEA), global Crude Oil demand is going to settle into a much lower range than previously expected, with the IEA lowering its 2024 growth forecast. The IEA now expects global oil demand to grow by just 1.22 million barrels per day this year, down from the previous month’s estimate and coming in well below the forecast 2.25 million bpd growth forecast by the Organization for the Petroleum Exporting Countries (OPEC).
The IEA also expanded its projections for 2024’s production growth, forecasting global Crude Oil production to grow by 1.7 million bpd compared to the previous forecast of 1.5 million bpd. The IEA now expects global Crude Oil production will expand to a record 103.8 million barrels per day, fueled by production growth from non-OPEC entities, primarily the US.
Despite OPEC’s insinuation that they will be able to cut production enough to keep global crude markets constrained, the IEA expects demand for OPEC+ Crude Oil to continue to come in below current production targets.
Thursday’s rebound in the WTI sees US Crude Oil climbing back into the 200-day Simple Moving Average (SMA) near $77.40 as WTI grinds its way back towards the $78.00 handle.
WTI is set to close once more in the green, offsetting Wednesday’s declines and putting US Crude Oil on pace to close higher for eight of the last nine consecutive trading days.
Technical Levels: Supports and Resistances
XTIUSD currently trading at 77.59 at the time of writing. Pair opened at 76.33 and is trading with a change of 1.65 % .
| Overview | Overview.1 | |
|---|---|---|
| 0 | Today last price | 77.59 |
| 1 | Today Daily Change | 1.26 |
| 2 | Today Daily Change % | 1.65 |
| 3 | Today daily open | 76.33 |
The pair remains strongly bullish on the daily timeframe. It trades above its 20 SMA @ 75.4, 50 SMA 73.55, 100 SMA @ 77.16 and 200 SMA @ 77.38.
| Trends | Trends.1 | |
|---|---|---|
| 0 | Daily SMA20 | 75.40 |
| 1 | Daily SMA50 | 73.55 |
| 2 | Daily SMA100 | 77.16 |
| 3 | Daily SMA200 | 77.38 |
The previous day high was 78.43 while the previous day low was 76.12. The daily 38.2% Fib levels comes at 77.0, expected to provide support. Similarly, the daily 61.8% fib level is at 77.55, expected to provide support.
Note the levels of interest below:
- Pivot support is noted at 75.49, 74.65, 73.18
- Pivot resistance is noted at 77.8, 79.27, 80.11
| Levels | Levels.1 |
|---|---|
| Previous Daily High | 78.43 |
| Previous Daily Low | 76.12 |
| Previous Weekly High | 77.18 |
| Previous Weekly Low | 71.46 |
| Previous Monthly High | 79.19 |
| Previous Monthly Low | 69.41 |
| Daily Fibonacci 38.2% | 77.00 |
| Daily Fibonacci 61.8% | 77.55 |
| Daily Pivot Point S1 | 75.49 |
| Daily Pivot Point S2 | 74.65 |
| Daily Pivot Point S3 | 73.18 |
| Daily Pivot Point R1 | 77.80 |
| Daily Pivot Point R2 | 79.27 |
| Daily Pivot Point R3 | 80.11 |
[/s2If]
Nehcap Trading Strategies
The NEHCAP currently runs the following trading systems for clients. They can be bought and run on your funds.
The system is trading live: LIVE ACCOUNT TRACKING
Contact Us: Contact
The HFT_FIX can be run free for 2 weeks on any broker with a ECN. Apply for a free trial
Join Our Telegram Group
")


