Crude Oil markets remain pinned into near-term highs as geopolitical headlines weigh. (Pivot Orderbook analysis)
…
This is a premium post.
[s2If !current_user_can(access_s2member_level4)]Please register for FREE REGISTER to read full post below containing analysis. In case of any error or you think you are not able to read the full post below, please email us at support#nehcap.com [lwa][/s2If] [s2If current_user_can(access_s2member_level1)]
- Crude Oil markets remain pinned into near-term highs as geopolitical headlines weigh.
- Gaza ceasefire hopes remain, but tensions remain high.
- US Crude Oil production continues to rise, offsetting OPEC production caps.
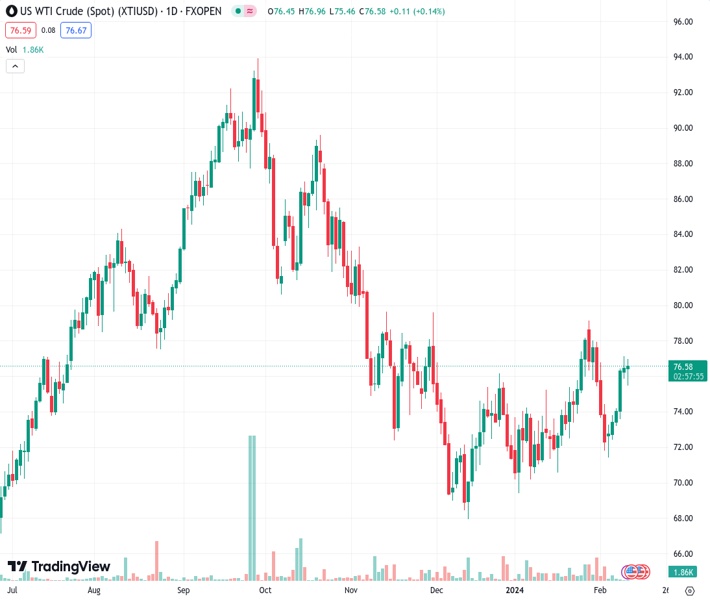
The pair currently trades last at 76.67.
The previous day high was 77.18 while the previous day low was 75.89. The daily 38.2% Fib levels comes at 76.69, expected to provide resistance. Similarly, the daily 61.8% fib level is at 76.38, expected to provide support.
West Texas Intermediate (WTI) US Crude Oil continued to test into $77.00 per barrel on Monday, with barrel bids pushing into recent highs as a potential ceasefire in the Gaza region remains elusive.
Geopolitical headlines have pushed US Crude Oil into five straight days of gains, sending WTI higher by around 6% last week. Energy markets are keeping prices on the high side heading into the new week, but it’s getting difficult for barrel investors to keep attention off of record Crude Oil production in the US.
Israel rejected an immediate proposal for a ceasefire last week, keeping Crude Oil markets pinned into the high end, but negotiations are still ongoing as key nations try to keep a lid on potential spillover from geopolitical risks.
Saudi Arabia’s Energy Minister, Abdulaziz bin Salman Al Saud, noted on Monday that the Organization of the Petroleum Exporting Countries (OPEC) remains able and willing to adjust policy as needed. OPEC has faced an uphill climb in recent months as OPEC production caps get washed out by US Crude Oil production continuing to climb into record highs as the US further cements itself as the world’s largest Crude Oil producer.
US Crude Oil production reached a familiar peak in January despite cold weather snaps that shuttered some production facilities temporarily. US pumping output hit its highest levels since last November.
WTI US Crude Oil remains well-bid, but capped just below the $77.00 key level. WTI remains up over 7% from last week’s bottom bids near $71.50, but struggles to find the bullish momentum needed to push barrel bids back into January’s peak near $79.00.
WTI continues to trade into the 200-day Simple Moving Average (SMA) near $77.30, and five straight days of WTI gains leaves US Crude Oil stuck near familiar technical highs. The long-term median 200-day SMA is capping off bullish momentum, and Crude Oil finds itself hamstrung in a consolidation zone between the 200-day SMA and the 50-day SMA near $73.25.
Technical Levels: Supports and Resistances
XTIUSD currently trading at 76.67 at the time of writing. Pair opened at 76.51 and is trading with a change of 0.21 % .
| Overview | Overview.1 | |
|---|---|---|
| 0 | Today last price | 76.67 |
| 1 | Today Daily Change | 0.16 |
| 2 | Today Daily Change % | 0.21 |
| 3 | Today daily open | 76.51 |
The pair is trading above its 20 Daily moving average @ 74.72, above its 50 Daily moving average @ 73.25 , below its 100 Daily moving average @ 77.57 and below its 200 Daily moving average @ 77.32
| Trends | Trends.1 | |
|---|---|---|
| 0 | Daily SMA20 | 74.72 |
| 1 | Daily SMA50 | 73.25 |
| 2 | Daily SMA100 | 77.57 |
| 3 | Daily SMA200 | 77.32 |
The previous day high was 77.18 while the previous day low was 75.89. The daily 38.2% Fib levels comes at 76.69, expected to provide resistance. Similarly, the daily 61.8% fib level is at 76.38, expected to provide support.
Note the levels of interest below:
- Pivot support is noted at 75.88, 75.24, 74.59
- Pivot resistance is noted at 77.16, 77.81, 78.45
| Levels | Levels.1 |
|---|---|
| Previous Daily High | 77.18 |
| Previous Daily Low | 75.89 |
| Previous Weekly High | 77.18 |
| Previous Weekly Low | 71.46 |
| Previous Monthly High | 79.19 |
| Previous Monthly Low | 69.41 |
| Daily Fibonacci 38.2% | 76.69 |
| Daily Fibonacci 61.8% | 76.38 |
| Daily Pivot Point S1 | 75.88 |
| Daily Pivot Point S2 | 75.24 |
| Daily Pivot Point S3 | 74.59 |
| Daily Pivot Point R1 | 77.16 |
| Daily Pivot Point R2 | 77.81 |
| Daily Pivot Point R3 | 78.45 |
[/s2If]
Nehcap Trading Strategies
The NEHCAP currently runs the following trading systems for clients. They can be bought and run on your funds.
The system is trading live: LIVE ACCOUNT TRACKING
Contact Us: Contact
The HFT_FIX can be run free for 2 weeks on any broker with a ECN. Apply for a free trial
Join Our Telegram Group
")


