WTI maintains its bullish bias after Israel rejected Hamas’s ceasefire deal. (Pivot Orderbook analysis)
…
This is a premium post.
[s2If !current_user_can(access_s2member_level4)]Please register for FREE REGISTER to read full post below containing analysis. In case of any error or you think you are not able to read the full post below, please email us at support#nehcap.com [lwa][/s2If] [s2If current_user_can(access_s2member_level1)]
- WTI maintains its bullish bias after Israel rejected Hamas’s ceasefire deal.
- A combination of factors keeps a lid on any further appreciating move.
- The black liquid remains on track to register strong weekly gains.
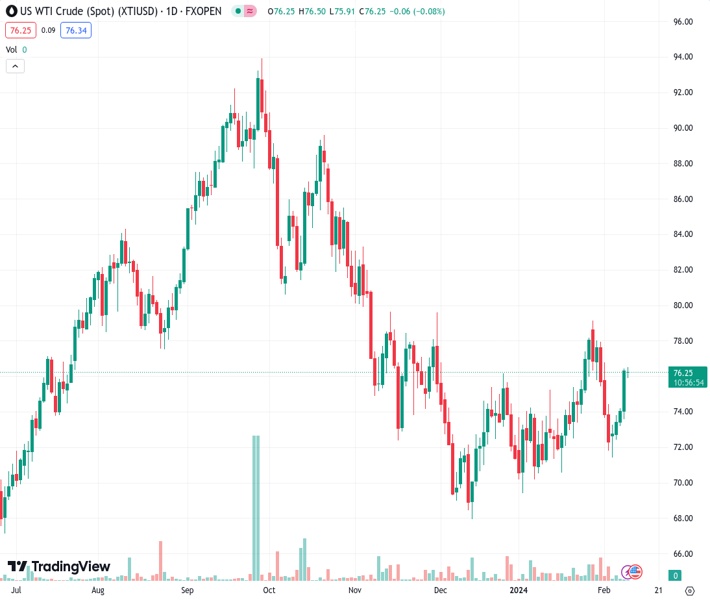
The pair currently trades last at 76.28.
The previous day high was 76.47 while the previous day low was 73.64. The daily 38.2% Fib levels comes at 75.39, expected to provide support. Similarly, the daily 61.8% fib level is at 74.72, expected to provide support.
West Texas Intermediate (WTI) US Crude Oil prices struggle to capitalize on strong weekly gains registered over the past four days and oscillate in a narrow trading band through the first half of the European session on Friday. The commodity, however, holds steady above the $76.00/barrel mark, or the weekly top and remains well within the striking distance of a technically significant 200-day Simple Moving Average (SMA).
Israel’s Prime Minister Benjamin Netanyahu has rejected a proposal to end the war in the Palestinian enclave, raising the risk of a further escalation of geopolitical tensions in the Middle East – the major Oil producing region. This comes on top of the continuous US strikes against Iran-backed Houthi targets in Yemen, which has been fueling supply concerns and is seen acting as a tailwind for Crude Oil prices. That said, a combination of factors is holding back traders from placing aggressive bullish bets and capping the upside.
Investors remain concerned about a weaker demand outlook in the wake of slowing economic growth in China – the world’s top Oil importer. Adding to this, output from Norway and Guyana is increasing, while Russia is exporting more crude in February in the wake of damage to refineries from Ukraine’s drone attacks and technical outages. This, to a larger extent, offsets the US refinery maintenance, which, along with a bullish US Dollar (USD), bolstered by hawkish Federal Reserve (Fed) expectations, keeps a lid on Crude Oil prices.
Nevertheless, the black liquid remains on track to register strong weekly gains as market participants look forward to the crucial US consumer inflation figures next week for cues about the Fed’s rate-cut path. In the meantime, the lower US output growth forecast by the Energy Information Administration (EIA), along with persistent geopolitical risks, might continue to lend some support to Crude Oil prices.
Technical Levels: Supports and Resistances
XTIUSD currently trading at 76.28 at the time of writing. Pair opened at 76.39 and is trading with a change of -0.14 % .
| Overview | Overview.1 | |
|---|---|---|
| 0 | Today last price | 76.28 |
| 1 | Today Daily Change | -0.11 |
| 2 | Today Daily Change % | -0.14 |
| 3 | Today daily open | 76.39 |
The pair is trading above its 20 Daily moving average @ 74.54, above its 50 Daily moving average @ 73.2 , below its 100 Daily moving average @ 77.71 and below its 200 Daily moving average @ 77.3
| Trends | Trends.1 | |
|---|---|---|
| 0 | Daily SMA20 | 74.54 |
| 1 | Daily SMA50 | 73.20 |
| 2 | Daily SMA100 | 77.71 |
| 3 | Daily SMA200 | 77.30 |
The previous day high was 76.47 while the previous day low was 73.64. The daily 38.2% Fib levels comes at 75.39, expected to provide support. Similarly, the daily 61.8% fib level is at 74.72, expected to provide support.
Note the levels of interest below:
- Pivot support is noted at 74.53, 72.66, 71.69
- Pivot resistance is noted at 77.36, 78.34, 80.2
| Levels | Levels.1 |
|---|---|
| Previous Daily High | 76.47 |
| Previous Daily Low | 73.64 |
| Previous Weekly High | 79.19 |
| Previous Weekly Low | 71.83 |
| Previous Monthly High | 79.19 |
| Previous Monthly Low | 69.41 |
| Daily Fibonacci 38.2% | 75.39 |
| Daily Fibonacci 61.8% | 74.72 |
| Daily Pivot Point S1 | 74.53 |
| Daily Pivot Point S2 | 72.66 |
| Daily Pivot Point S3 | 71.69 |
| Daily Pivot Point R1 | 77.36 |
| Daily Pivot Point R2 | 78.34 |
| Daily Pivot Point R3 | 80.20 |
[/s2If]
Nehcap Trading Strategies
The NEHCAP currently runs the following trading systems for clients. They can be bought and run on your funds.
The system is trading live: LIVE ACCOUNT TRACKING
Contact Us: Contact
The HFT_FIX can be run free for 2 weeks on any broker with a ECN. Apply for a free trial
Join Our Telegram Group
")


