WTI price could gain ground as Israel has dismissed Hamas’ offer for a ceasefire. (Pivot Orderbook analysis)
…
This is a premium post.
[s2If !current_user_can(access_s2member_level4)]Please register for FREE REGISTER to read full post below containing analysis. In case of any error or you think you are not able to read the full post below, please email us at support#nehcap.com [lwa][/s2If] [s2If current_user_can(access_s2member_level1)]
- WTI price could gain ground as Israel has dismissed Hamas’ offer for a ceasefire.
- EIA Crude Oil stockpiles came in at 5.521 million barrels against the expected 1.895 million barrels.
- The largest US oilfield, the Permian shale basin, is projected to experience its slowest annual growth since 2021.
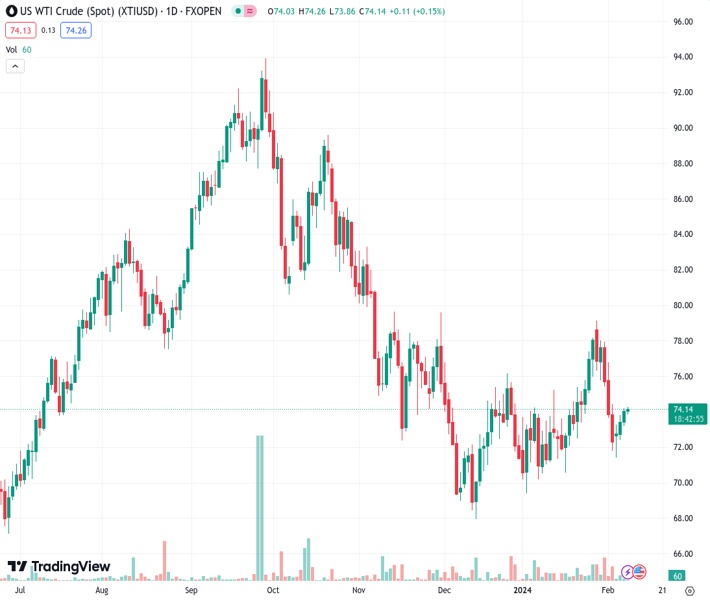
The pair currently trades last at 74.24.
The previous day high was 74.24 while the previous day low was 73.27. The daily 38.2% Fib levels comes at 73.87, expected to provide support. Similarly, the daily 61.8% fib level is at 73.64, expected to provide support.
West Texas Intermediate (WTI) oil price hovers around $74.20 per barrel during the Asian session on Thursday. Crude oil prices are expected to continue their winning streak for the fourth consecutive session. WTI price receives upward support as an obstacle emerges on a ceasefire in the Israel-Gaza conflict.
Israeli Prime Minister Benjamin Netanyahu has dismissed Hamas’ offer for a ceasefire and the release of hostages held in the Gaza Strip. Nonetheless, US Secretary of State Antony Blinken has hinted at the possibility of further negotiations to achieve a resolution. Additionally, a delegation from Hamas, led by senior official Khalil Al-Hayya, is set to journey to Cairo on Thursday for talks with Egypt and Qatar aimed at reaching a ceasefire agreement.
The American Petroleum Institute (API) Weekly Crude Oil Stock exhibited improvement, reporting a figure of 0.674 million barrels, contrasting with the prior decrease of 2.5 million barrels. Despite this, the reported figure fell notably short of the anticipated 2.133 million barrels for the week ending on February 2, providing support for Crude oil prices.
However, the US Energy Information Administration (EIA) reported Crude Oil stockpiles at 5.521 million barrels, surpassing both the expected 1.895 million barrels and the previous figure of 1.234 million barrels. This may have tempered the rise in oil prices.
Additionally, the Permian shale basin, the largest US oilfield spanning Texas and New Mexico, is projected to experience its slowest annual growth since 2021. This development is further bolstering oil prices, as the deceleration in growth will limit overall gains in US production. Coupled with the EIA’s revised forecast for a decline in US oil production growth in 2024.
Technical Levels: Supports and Resistances
XTIUSD currently trading at 74.24 at the time of writing. Pair opened at 74.18 and is trading with a change of 0.08 % .
| Overview | Overview.1 | |
|---|---|---|
| 0 | Today last price | 74.24 |
| 1 | Today Daily Change | 0.06 |
| 2 | Today Daily Change % | 0.08 |
| 3 | Today daily open | 74.18 |
The pair is trading below its 20 Daily moving average @ 74.34, above its 50 Daily moving average @ 73.18 , below its 100 Daily moving average @ 77.84 and below its 200 Daily moving average @ 77.26
| Trends | Trends.1 | |
|---|---|---|
| 0 | Daily SMA20 | 74.34 |
| 1 | Daily SMA50 | 73.18 |
| 2 | Daily SMA100 | 77.84 |
| 3 | Daily SMA200 | 77.26 |
The previous day high was 74.24 while the previous day low was 73.27. The daily 38.2% Fib levels comes at 73.87, expected to provide support. Similarly, the daily 61.8% fib level is at 73.64, expected to provide support.
Note the levels of interest below:
- Pivot support is noted at 73.55, 72.93, 72.58
- Pivot resistance is noted at 74.52, 74.87, 75.49
| Levels | Levels.1 |
|---|---|
| Previous Daily High | 74.24 |
| Previous Daily Low | 73.27 |
| Previous Weekly High | 79.19 |
| Previous Weekly Low | 71.83 |
| Previous Monthly High | 79.19 |
| Previous Monthly Low | 69.41 |
| Daily Fibonacci 38.2% | 73.87 |
| Daily Fibonacci 61.8% | 73.64 |
| Daily Pivot Point S1 | 73.55 |
| Daily Pivot Point S2 | 72.93 |
| Daily Pivot Point S3 | 72.58 |
| Daily Pivot Point R1 | 74.52 |
| Daily Pivot Point R2 | 74.87 |
| Daily Pivot Point R3 | 75.49 |
[/s2If]
Nehcap Trading Strategies
The NEHCAP currently runs the following trading systems for clients. They can be bought and run on your funds.
The system is trading live: LIVE ACCOUNT TRACKING
Contact Us: Contact
The HFT_FIX can be run free for 2 weeks on any broker with a ECN. Apply for a free trial
Join Our Telegram Group
")


