WTI prices attract some buyers near $72.90 amid the ongoing Middle East tension. (Pivot Orderbook analysis)
…
This is a premium post.
[s2If !current_user_can(access_s2member_level4)]Please register for FREE REGISTER to read full post below containing analysis. In case of any error or you think you are not able to read the full post below, please email us at support#nehcap.com [lwa][/s2If] [s2If current_user_can(access_s2member_level1)]
- WTI prices attract some buyers near $72.90 amid the ongoing Middle East tension.
- The upbeat US economic data might convince the Federal Reserve (Fed) to keep its benchmark rate higher for longer.
- The US launched retaliatory airstrikes on Friday against Iran’s Islamic Revolutionary Guard Corps and allied militias in Iraq and Syria.
The pair currently trades last at 72.96.
The previous day high was 73.29 while the previous day low was 71.46. The daily 38.2% Fib levels comes at 72.59, expected to provide support. Similarly, the daily 61.8% fib level is at 72.16, expected to provide support.
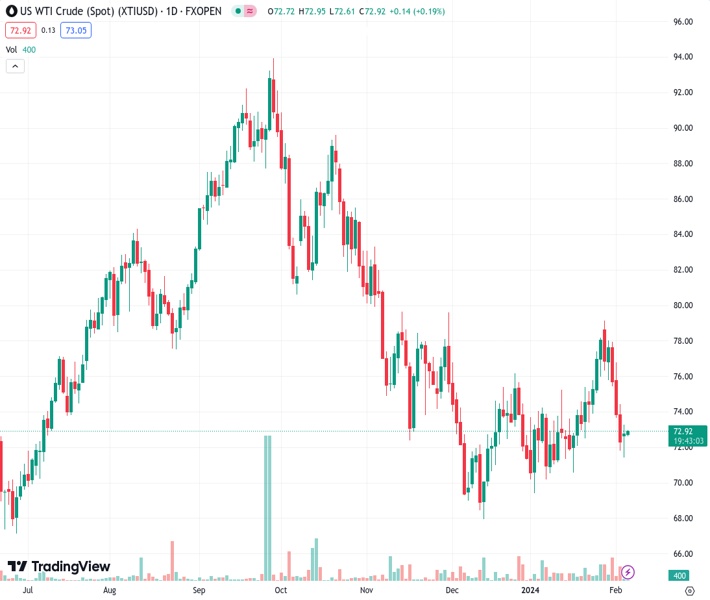
Western Texas Intermediate (WTI), the US crude oil benchmark, is trading around $72.90 on Tuesday. WTI prices edge higher on the modest decline of US Dollar (USD). The downside of WTI prices might be capped by concerns that tensions in the Middle East and Russia’s ongoing invasion of Ukraine could curb global supplies.
The stronger-than-expected US PMI and Nonfarm Payrolls (NFP) data might convince the Federal Reserve (Fed) to keep its benchmark rate higher for longer, which would lift the Greenback broadly and exert some selling pressure on WTI prices. The ISM showed on Monday that the US Services PMI rose to 53.4 in January from 50.5 in December.
On the other hand, the geopolitical tensions in the Middle East might cap the downside of oil prices. The United States started retaliatory airstrikes Friday against Iran’s Islamic Revolutionary Guard Corps and associated forces in Iraq and Syria. The attacks, which targeted over 85 locations, were in reaction to the deaths of three US servicemen in a drone strike by Iranian insurgents.
The US launched retaliatory airstrikes on Friday against Iran’s Islamic Revolutionary Guard Corps and allied militias in Iraq and Syria. The airstrikes, which hit more than 85 targets, came in response to the deaths of three US troops in a drone strike by Iran-allied militants. This, in turn, might cap the downside of WTI prices in the near term.
Oil traders will monitor the Chinese Consumer Price Index (CPI) and Producer Price Index (PPI) for January on Thursday. The weaker-than-expected data could weigh on WTI prices, as China is the world’s second-largest oil consumer.
Technical Levels: Supports and Resistances
XTIUSD currently trading at 72.96 at the time of writing. Pair opened at 72.89 and is trading with a change of 0.1 % .
| Overview | Overview.1 | |
|---|---|---|
| 0 | Today last price | 72.96 |
| 1 | Today Daily Change | 0.07 |
| 2 | Today Daily Change % | 0.10 |
| 3 | Today daily open | 72.89 |
The pair remains strongly bearish on the daily time frame. It trades below the 20 SMA @ 74.13, 50 SMA 73.31, 100 SMA @ 78.16 and 200 SMA @ 77.22.
| Trends | Trends.1 | |
|---|---|---|
| 0 | Daily SMA20 | 74.13 |
| 1 | Daily SMA50 | 73.31 |
| 2 | Daily SMA100 | 78.16 |
| 3 | Daily SMA200 | 77.22 |
The previous day high was 73.29 while the previous day low was 71.46. The daily 38.2% Fib levels comes at 72.59, expected to provide support. Similarly, the daily 61.8% fib level is at 72.16, expected to provide support.
Note the levels of interest below:
- Pivot support is noted at 71.81, 70.72, 69.98
- Pivot resistance is noted at 73.64, 74.38, 75.47
| Levels | Levels.1 |
|---|---|
| Previous Daily High | 73.29 |
| Previous Daily Low | 71.46 |
| Previous Weekly High | 79.19 |
| Previous Weekly Low | 71.83 |
| Previous Monthly High | 79.19 |
| Previous Monthly Low | 69.41 |
| Daily Fibonacci 38.2% | 72.59 |
| Daily Fibonacci 61.8% | 72.16 |
| Daily Pivot Point S1 | 71.81 |
| Daily Pivot Point S2 | 70.72 |
| Daily Pivot Point S3 | 69.98 |
| Daily Pivot Point R1 | 73.64 |
| Daily Pivot Point R2 | 74.38 |
| Daily Pivot Point R3 | 75.47 |
[/s2If]
Nehcap Trading Strategies
The NEHCAP currently runs the following trading systems for clients. They can be bought and run on your funds.
The system is trading live: LIVE ACCOUNT TRACKING
Contact Us: Contact
The HFT_FIX can be run free for 2 weeks on any broker with a ECN. Apply for a free trial
Join Our Telegram Group
")


